Data
87,991 items of data are available, covering 83,309 participants.
Defined-instances run from 2 to 3, labelled using Instancing
2.
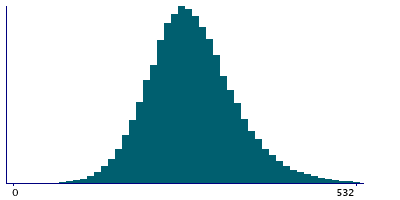
Units of measurement are mm2.
| Maximum | 659 |
| Decile 9 | 363 |
| Decile 8 | 328 |
| Decile 7 | 306 |
| Decile 6 | 288 |
| Median | 272 |
| Decile 4 | 256 |
| Decile 3 | 240 |
| Decile 2 | 221 |
| Decile 1 | 195 |
| Minimum | 0 |
|

|
- Mean = 276.071
- Std.dev = 67.9198
- 145 items above graph maximum of 531
|
2 Instances
Instance 2 : Imaging visit (2014+)
83,236 participants, 83,236 items
| Maximum | 659 |
| Decile 9 | 363 |
| Decile 8 | 328 |
| Decile 7 | 306 |
| Decile 6 | 288 |
| Median | 271 |
| Decile 4 | 256 |
| Decile 3 | 239 |
| Decile 2 | 221 |
| Decile 1 | 195 |
| Minimum | 0 |
|
|
- Mean = 275.917
- Std.dev = 67.8691
- 137 items above graph maximum of 531
|
Instance 3 : First repeat imaging visit (2019+)
4,755 participants, 4,755 items
| Maximum | 655 |
| Decile 9 | 366 |
| Decile 8 | 331 |
| Decile 7 | 308 |
| Decile 6 | 290 |
| Median | 274 |
| Decile 4 | 258 |
| Decile 3 | 241 |
| Decile 2 | 223 |
| Decile 1 | 197 |
| Minimum | 34 |
|

|
- Mean = 278.776
- Std.dev = 68.7436
- 7 items above graph maximum of 535
|
Notes
Area of S-temporal-transverse in the left hemisphere generated by parcellation of the white surface using Destrieux (a2009s) parcellation
0 Related Data-Fields
There are no related data-fields
0 Resources
There are no matching Resources
