Data
87,996 items of data are available, covering 83,313 participants.
Defined-instances run from 2 to 3, labelled using Instancing
2.
Units of measurement are mm.
| Maximum | 3.542 |
| Decile 9 | 3.021 |
| Decile 8 | 2.953 |
| Decile 7 | 2.904 |
| Decile 6 | 2.86 |
| Median | 2.817 |
| Decile 4 | 2.773 |
| Decile 3 | 2.724 |
| Decile 2 | 2.663 |
| Decile 1 | 2.574 |
| Minimum | 1.203 |
|
|
- Mean = 2.80502
- Std.dev = 0.178211
- 93 items below graph minimum of 2.127
- 2 items above graph maximum of 3.468
|
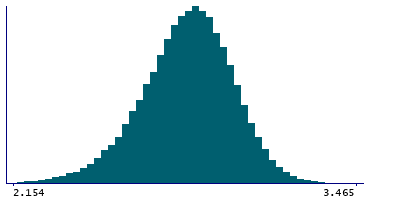
2 Instances
Instance 2 : Imaging visit (2014+)
83,241 participants, 83,241 items
| Maximum | 3.542 |
| Decile 9 | 3.019 |
| Decile 8 | 2.952 |
| Decile 7 | 2.902 |
| Decile 6 | 2.858 |
| Median | 2.815 |
| Decile 4 | 2.771 |
| Decile 3 | 2.722 |
| Decile 2 | 2.661 |
| Decile 1 | 2.571 |
| Minimum | 1.871 |
|

|
- Mean = 2.80317
- Std.dev = 0.178557
- 89 items below graph minimum of 2.123
- 2 items above graph maximum of 3.467
|
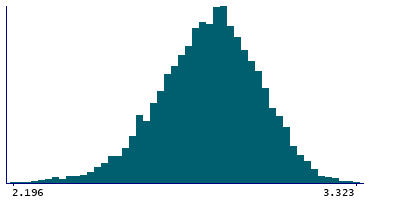
Instance 3 : First repeat imaging visit (2019+)
4,755 participants, 4,755 items
| Maximum | 3.323 |
| Decile 9 | 3.044 |
| Decile 8 | 2.979 |
| Decile 7 | 2.929 |
| Decile 6 | 2.885 |
| Median | 2.848 |
| Decile 4 | 2.806 |
| Decile 3 | 2.76 |
| Decile 2 | 2.704 |
| Decile 1 | 2.62 |
| Minimum | 1.203 |
|
|
- Mean = 2.83726
- Std.dev = 0.16881
- 4 items below graph minimum of 2.196
|
Notes
Mean thickness of G-front-middle in the left hemisphere generated by parcellation of the white surface using Destrieux (a2009s) parcellation
0 Related Data-Fields
There are no related data-fields
0 Resources
There are no matching Resources
