Data
87,996 items of data are available, covering 83,313 participants.
Defined-instances run from 2 to 3, labelled using Instancing
2.
Units of measurement are mm.
| Maximum | 3.151 |
| Decile 9 | 2.459 |
| Decile 8 | 2.379 |
| Decile 7 | 2.322 |
| Decile 6 | 2.273 |
| Median | 2.227 |
| Decile 4 | 2.181 |
| Decile 3 | 2.132 |
| Decile 2 | 2.073 |
| Decile 1 | 1.99 |
| Minimum | 0.799 |
|
|
- Mean = 2.22582
- Std.dev = 0.183842
- 17 items below graph minimum of 1.521
- 14 items above graph maximum of 2.928
|
2 Instances
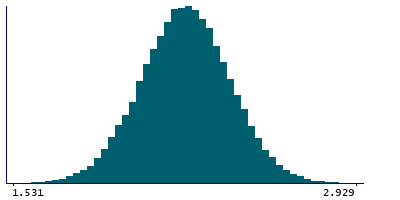
Instance 2 : Imaging visit (2014+)
83,241 participants, 83,241 items
| Maximum | 3.151 |
| Decile 9 | 2.459 |
| Decile 8 | 2.379 |
| Decile 7 | 2.322 |
| Decile 6 | 2.273 |
| Median | 2.227 |
| Decile 4 | 2.181 |
| Decile 3 | 2.131 |
| Decile 2 | 2.073 |
| Decile 1 | 1.99 |
| Minimum | 1.338 |
|

|
- Mean = 2.22544
- Std.dev = 0.183889
- 15 items below graph minimum of 1.521
- 13 items above graph maximum of 2.928
|
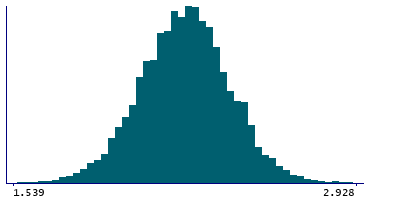
Instance 3 : First repeat imaging visit (2019+)
4,755 participants, 4,755 items
| Maximum | 2.931 |
| Decile 9 | 2.465 |
| Decile 8 | 2.382 |
| Decile 7 | 2.326 |
| Decile 6 | 2.279 |
| Median | 2.2355 |
| Decile 4 | 2.191 |
| Decile 3 | 2.14 |
| Decile 2 | 2.081 |
| Decile 1 | 2.002 |
| Minimum | 0.799 |
|
|
- Mean = 2.23236
- Std.dev = 0.182906
- 2 items below graph minimum of 1.539
- 1 item above graph maximum of 2.928
|
Notes
Mean thickness of G-occipital-sup in the left hemisphere generated by parcellation of the white surface using Destrieux (a2009s) parcellation
0 Related Data-Fields
There are no related data-fields
0 Resources
There are no matching Resources
