Data
87,996 items of data are available, covering 83,313 participants.
Defined-instances run from 2 to 3, labelled using Instancing
2.
Units of measurement are mm.
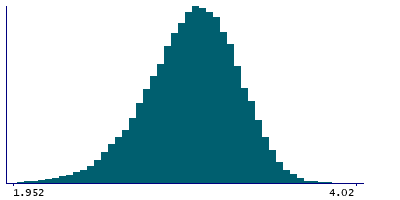
| Maximum | 4.032 |
| Decile 9 | 3.347 |
| Decile 8 | 3.242 |
| Decile 7 | 3.162 |
| Decile 6 | 3.091 |
| Median | 3.023 |
| Decile 4 | 2.951 |
| Decile 3 | 2.871 |
| Decile 2 | 2.772 |
| Decile 1 | 2.627 |
| Minimum | 1.237 |
|
|
- Mean = 3.00057
- Std.dev = 0.286821
- 120 items below graph minimum of 1.907
|
2 Instances
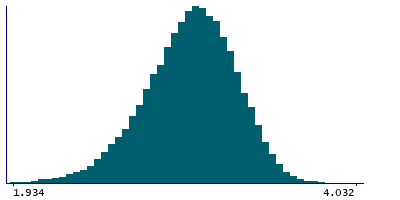
Instance 2 : Imaging visit (2014+)
83,241 participants, 83,241 items
| Maximum | 4.032 |
| Decile 9 | 3.347 |
| Decile 8 | 3.241 |
| Decile 7 | 3.161 |
| Decile 6 | 3.09 |
| Median | 3.022 |
| Decile 4 | 2.95 |
| Decile 3 | 2.87 |
| Decile 2 | 2.77 |
| Decile 1 | 2.625 |
| Minimum | 1.237 |
|
|
- Mean = 2.99943
- Std.dev = 0.28731
- 110 items below graph minimum of 1.903
|
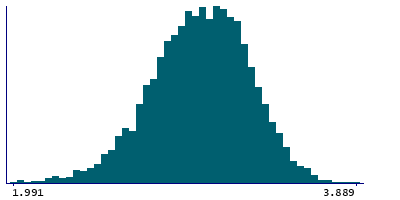
Instance 3 : First repeat imaging visit (2019+)
4,755 participants, 4,755 items
| Maximum | 3.889 |
| Decile 9 | 3.357 |
| Decile 8 | 3.253 |
| Decile 7 | 3.177 |
| Decile 6 | 3.109 |
| Median | 3.034 |
| Decile 4 | 2.963 |
| Decile 3 | 2.887 |
| Decile 2 | 2.798 |
| Decile 1 | 2.674 |
| Minimum | 1.251 |
|
|
- Mean = 3.02037
- Std.dev = 0.277369
- 9 items below graph minimum of 1.991
|
Notes
Mean thickness of G-oc-temp-med-Parahip in the left hemisphere generated by parcellation of the white surface using Destrieux (a2009s) parcellation
0 Related Data-Fields
There are no related data-fields
0 Resources
There are no matching Resources
