Data
87,996 items of data are available, covering 83,313 participants.
Defined-instances run from 2 to 3, labelled using Instancing
2.
Units of measurement are mm.
| Maximum | 3.873 |
| Decile 9 | 3.277 |
| Decile 8 | 3.189 |
| Decile 7 | 3.12 |
| Decile 6 | 3.058 |
| Median | 2.997 |
| Decile 4 | 2.934 |
| Decile 3 | 2.86 |
| Decile 2 | 2.767 |
| Decile 1 | 2.623 |
| Minimum | 1.078 |
|

|
- Mean = 2.96932
- Std.dev = 0.263201
- 163 items below graph minimum of 1.969
|
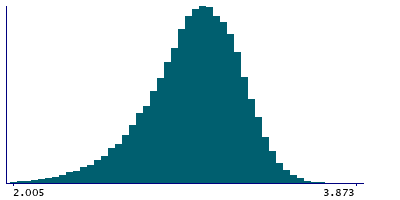
2 Instances
Instance 2 : Imaging visit (2014+)
83,241 participants, 83,241 items
| Maximum | 3.873 |
| Decile 9 | 3.275 |
| Decile 8 | 3.187 |
| Decile 7 | 3.119 |
| Decile 6 | 3.056 |
| Median | 2.995 |
| Decile 4 | 2.932 |
| Decile 3 | 2.858 |
| Decile 2 | 2.765 |
| Decile 1 | 2.621 |
| Minimum | 1.392 |
|
|
- Mean = 2.96728
- Std.dev = 0.263638
- 153 items below graph minimum of 1.967
|
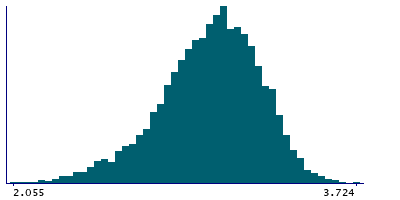
Instance 3 : First repeat imaging visit (2019+)
4,755 participants, 4,755 items
| Maximum | 3.724 |
| Decile 9 | 3.305 |
| Decile 8 | 3.217 |
| Decile 7 | 3.1485 |
| Decile 6 | 3.086 |
| Median | 3.03 |
| Decile 4 | 2.967 |
| Decile 3 | 2.896 |
| Decile 2 | 2.814 |
| Decile 1 | 2.68 |
| Minimum | 1.078 |
|
|
- Mean = 3.00498
- Std.dev = 0.252782
- 15 items below graph minimum of 2.055
|
Notes
Mean thickness of G-precentral in the left hemisphere generated by parcellation of the white surface using Destrieux (a2009s) parcellation
0 Related Data-Fields
There are no related data-fields
0 Resources
There are no matching Resources
