Data
87,996 items of data are available, covering 83,313 participants.
Defined-instances run from 2 to 3, labelled using Instancing
2.
Units of measurement are mm.
| Maximum | 3.686 |
| Decile 9 | 3.062 |
| Decile 8 | 2.971 |
| Decile 7 | 2.906 |
| Decile 6 | 2.848 |
| Median | 2.792 |
| Decile 4 | 2.736 |
| Decile 3 | 2.674 |
| Decile 2 | 2.6 |
| Decile 1 | 2.495 |
| Minimum | 1.44 |
|

|
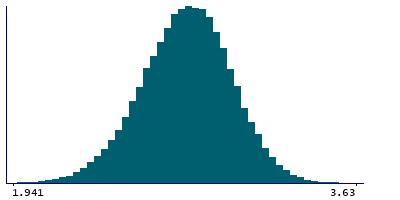
- Mean = 2.78438
- Std.dev = 0.22291
- 22 items below graph minimum of 1.928
- 3 items above graph maximum of 3.629
|
2 Instances
Instance 2 : Imaging visit (2014+)
83,241 participants, 83,241 items
| Maximum | 3.686 |
| Decile 9 | 3.061 |
| Decile 8 | 2.97 |
| Decile 7 | 2.905 |
| Decile 6 | 2.847 |
| Median | 2.791 |
| Decile 4 | 2.7345 |
| Decile 3 | 2.672 |
| Decile 2 | 2.599 |
| Decile 1 | 2.493 |
| Minimum | 1.44 |
|
|
- Mean = 2.78316
- Std.dev = 0.223253
- 20 items below graph minimum of 1.925
- 3 items above graph maximum of 3.629
|
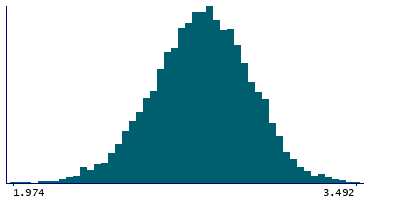
Instance 3 : First repeat imaging visit (2019+)
4,755 participants, 4,755 items
| Maximum | 3.492 |
| Decile 9 | 3.078 |
| Decile 8 | 2.987 |
| Decile 7 | 2.924 |
| Decile 6 | 2.864 |
| Median | 2.811 |
| Decile 4 | 2.758 |
| Decile 3 | 2.7 |
| Decile 2 | 2.63 |
| Decile 1 | 2.5265 |
| Minimum | 1.725 |
|
|
- Mean = 2.80579
- Std.dev = 0.215689
- 1 item below graph minimum of 1.975
|
Notes
Mean thickness of G-temp-sup-Plan-tempo in the left hemisphere generated by parcellation of the white surface using Destrieux (a2009s) parcellation
0 Related Data-Fields
There are no related data-fields
0 Resources
There are no matching Resources
