Data
87,996 items of data are available, covering 83,313 participants.
Defined-instances run from 2 to 3, labelled using Instancing
2.
Units of measurement are mm.
| Maximum | 3.871 |
| Decile 9 | 3.366 |
| Decile 8 | 3.291 |
| Decile 7 | 3.237 |
| Decile 6 | 3.192 |
| Median | 3.149 |
| Decile 4 | 3.105 |
| Decile 3 | 3.059 |
| Decile 2 | 3.002 |
| Decile 1 | 2.922 |
| Minimum | 1.552 |
|
|
- Mean = 3.14585
- Std.dev = 0.174607
- 40 items below graph minimum of 2.478
- 7 items above graph maximum of 3.81
|
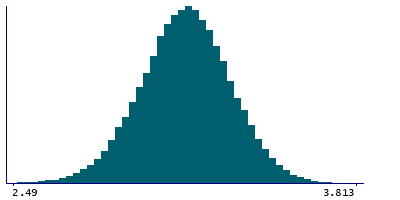
2 Instances
Instance 2 : Imaging visit (2014+)
83,241 participants, 83,241 items
| Maximum | 3.871 |
| Decile 9 | 3.366 |
| Decile 8 | 3.29 |
| Decile 7 | 3.237 |
| Decile 6 | 3.191 |
| Median | 3.148 |
| Decile 4 | 3.104 |
| Decile 3 | 3.058 |
| Decile 2 | 3.001 |
| Decile 1 | 2.921 |
| Minimum | 1.816 |
|

|
- Mean = 3.14501
- Std.dev = 0.17477
- 36 items below graph minimum of 2.476
- 5 items above graph maximum of 3.811
|
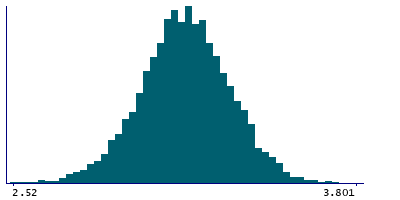
Instance 3 : First repeat imaging visit (2019+)
4,755 participants, 4,755 items
| Maximum | 3.847 |
| Decile 9 | 3.374 |
| Decile 8 | 3.3 |
| Decile 7 | 3.246 |
| Decile 6 | 3.203 |
| Median | 3.162 |
| Decile 4 | 3.12 |
| Decile 3 | 3.078 |
| Decile 2 | 3.026 |
| Decile 1 | 2.947 |
| Minimum | 1.552 |
|
|
- Mean = 3.16048
- Std.dev = 0.171052
- 4 items below graph minimum of 2.52
- 2 items above graph maximum of 3.801
|
Notes
Mean thickness of G-temporal-inf in the left hemisphere generated by parcellation of the white surface using Destrieux (a2009s) parcellation
0 Related Data-Fields
There are no related data-fields
0 Resources
There are no matching Resources
