Data
87,996 items of data are available, covering 83,313 participants.
Defined-instances run from 2 to 3, labelled using Instancing
2.
Units of measurement are mm.
| Maximum | 3.867 |
| Decile 9 | 3.343 |
| Decile 8 | 3.268 |
| Decile 7 | 3.212 |
| Decile 6 | 3.164 |
| Median | 3.117 |
| Decile 4 | 3.07 |
| Decile 3 | 3.018 |
| Decile 2 | 2.957 |
| Decile 1 | 2.868 |
| Minimum | 1.864 |
|
|
- Mean = 3.11015
- Std.dev = 0.188043
- 68 items below graph minimum of 2.393
- 3 items above graph maximum of 3.818
|
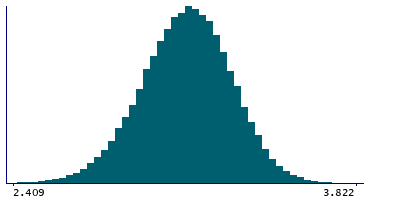
2 Instances
Instance 2 : Imaging visit (2014+)
83,241 participants, 83,241 items
| Maximum | 3.867 |
| Decile 9 | 3.342 |
| Decile 8 | 3.267 |
| Decile 7 | 3.212 |
| Decile 6 | 3.163 |
| Median | 3.117 |
| Decile 4 | 3.069 |
| Decile 3 | 3.017 |
| Decile 2 | 2.956 |
| Decile 1 | 2.866 |
| Minimum | 1.919 |
|

|
- Mean = 3.1094
- Std.dev = 0.188209
- 61 items below graph minimum of 2.39
- 3 items above graph maximum of 3.818
|
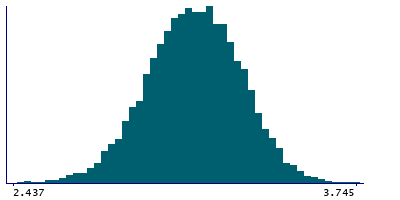
Instance 3 : First repeat imaging visit (2019+)
4,755 participants, 4,755 items
| Maximum | 3.745 |
| Decile 9 | 3.349 |
| Decile 8 | 3.278 |
| Decile 7 | 3.224 |
| Decile 6 | 3.175 |
| Median | 3.128 |
| Decile 4 | 3.08 |
| Decile 3 | 3.031 |
| Decile 2 | 2.974 |
| Decile 1 | 2.8935 |
| Minimum | 1.864 |
|
|
- Mean = 3.12317
- Std.dev = 0.184633
- 10 items below graph minimum of 2.438
|
Notes
Mean thickness of G-temporal-middle in the left hemisphere generated by parcellation of the white surface using Destrieux (a2009s) parcellation
0 Related Data-Fields
There are no related data-fields
0 Resources
There are no matching Resources
