Data
87,996 items of data are available, covering 83,313 participants.
Defined-instances run from 2 to 3, labelled using Instancing
2.
Units of measurement are mm.
| Maximum | 3.918 |
| Decile 9 | 2.529 |
| Decile 8 | 2.466 |
| Decile 7 | 2.419 |
| Decile 6 | 2.38 |
| Median | 2.344 |
| Decile 4 | 2.306 |
| Decile 3 | 2.266 |
| Decile 2 | 2.218 |
| Decile 1 | 2.148 |
| Minimum | 1.067 |
|

|
- Mean = 2.33978
- Std.dev = 0.152202
- 79 items below graph minimum of 1.767
- 12 items above graph maximum of 2.91
|
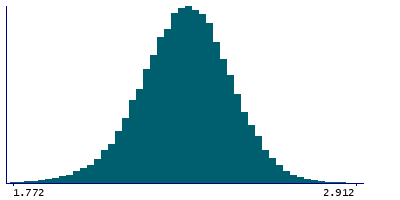
2 Instances
Instance 2 : Imaging visit (2014+)
83,241 participants, 83,241 items
| Maximum | 3.918 |
| Decile 9 | 2.529 |
| Decile 8 | 2.465 |
| Decile 7 | 2.419 |
| Decile 6 | 2.38 |
| Median | 2.343 |
| Decile 4 | 2.306 |
| Decile 3 | 2.265 |
| Decile 2 | 2.217 |
| Decile 1 | 2.147 |
| Minimum | 1.067 |
|
|
- Mean = 2.33924
- Std.dev = 0.15265
- 72 items below graph minimum of 1.765
- 11 items above graph maximum of 2.911
|
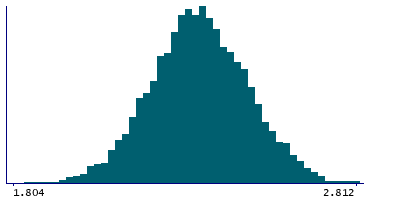
Instance 3 : First repeat imaging visit (2019+)
4,755 participants, 4,755 items
| Maximum | 2.812 |
| Decile 9 | 2.532 |
| Decile 8 | 2.471 |
| Decile 7 | 2.423 |
| Decile 6 | 2.383 |
| Median | 2.348 |
| Decile 4 | 2.313 |
| Decile 3 | 2.277 |
| Decile 2 | 2.232 |
| Decile 1 | 2.168 |
| Minimum | 1.382 |
|
|
- Mean = 2.34918
- Std.dev = 0.143805
- 3 items below graph minimum of 1.804
|
Notes
Mean thickness of S-oc-sup+transversal in the left hemisphere generated by parcellation of the white surface using Destrieux (a2009s) parcellation
0 Related Data-Fields
There are no related data-fields
0 Resources
There are no matching Resources
