Data
87,996 items of data are available, covering 83,313 participants.
Defined-instances run from 2 to 3, labelled using Instancing
2.
Units of measurement are mm2.
| Maximum | 1896 |
| Decile 9 | 1143 |
| Decile 8 | 1065 |
| Decile 7 | 1012 |
| Decile 6 | 969 |
| Median | 931 |
| Decile 4 | 895 |
| Decile 3 | 858 |
| Decile 2 | 818 |
| Decile 1 | 766 |
| Minimum | 469 |
|
|
- Mean = 945.277
- Std.dev = 149.159
- 92 items above graph maximum of 1520
|
2 Instances
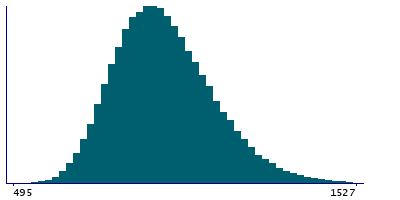
Instance 2 : Imaging visit (2014+)
83,241 participants, 83,241 items
| Maximum | 1896 |
| Decile 9 | 1143 |
| Decile 8 | 1065 |
| Decile 7 | 1012 |
| Decile 6 | 969 |
| Median | 931 |
| Decile 4 | 895 |
| Decile 3 | 858 |
| Decile 2 | 818 |
| Decile 1 | 766 |
| Minimum | 469 |
|

|
- Mean = 944.738
- Std.dev = 149.098
- 86 items above graph maximum of 1520
|
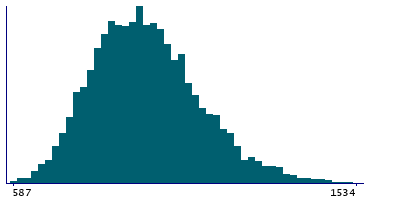
Instance 3 : First repeat imaging visit (2019+)
4,755 participants, 4,755 items
| Maximum | 1721 |
| Decile 9 | 1153 |
| Decile 8 | 1074 |
| Decile 7 | 1022 |
| Decile 6 | 979 |
| Median | 942 |
| Decile 4 | 905 |
| Decile 3 | 866 |
| Decile 2 | 826 |
| Decile 1 | 772 |
| Minimum | 587 |
|
|
- Mean = 954.717
- Std.dev = 149.922
- 6 items above graph maximum of 1534
|
Notes
Area of G+S-subcentral in the right hemisphere generated by parcellation of the white surface using Destrieux (a2009s) parcellation
0 Related Data-Fields
There are no related data-fields
0 Resources
There are no matching Resources
