Data
87,996 items of data are available, covering 83,313 participants.
Defined-instances run from 2 to 3, labelled using Instancing
2.
Units of measurement are mm2.
| Maximum | 1250 |
| Decile 9 | 656 |
| Decile 8 | 594 |
| Decile 7 | 552 |
| Decile 6 | 518 |
| Median | 489 |
| Decile 4 | 463 |
| Decile 3 | 437 |
| Decile 2 | 409 |
| Decile 1 | 375 |
| Minimum | 225 |
|

|
- Mean = 504.247
- Std.dev = 109.906
- 74 items above graph maximum of 937
|
2 Instances
Instance 2 : Imaging visit (2014+)
83,241 participants, 83,241 items
| Maximum | 1250 |
| Decile 9 | 656 |
| Decile 8 | 594 |
| Decile 7 | 551 |
| Decile 6 | 518 |
| Median | 489 |
| Decile 4 | 463 |
| Decile 3 | 437 |
| Decile 2 | 409 |
| Decile 1 | 375 |
| Minimum | 225 |
|

|
- Mean = 504.153
- Std.dev = 109.813
- 70 items above graph maximum of 937
|
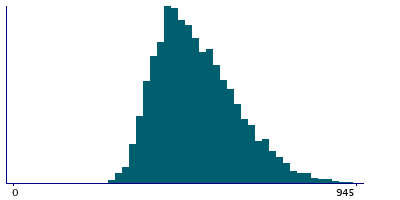
Instance 3 : First repeat imaging visit (2019+)
4,755 participants, 4,755 items
| Maximum | 1068 |
| Decile 9 | 660 |
| Decile 8 | 598 |
| Decile 7 | 555 |
| Decile 6 | 521 |
| Median | 489 |
| Decile 4 | 462 |
| Decile 3 | 435 |
| Decile 2 | 409 |
| Decile 1 | 375 |
| Minimum | 265 |
|
|
- Mean = 505.882
- Std.dev = 111.519
- 4 items above graph maximum of 945
|
Notes
Area of G-insular-short in the right hemisphere generated by parcellation of the white surface using Destrieux (a2009s) parcellation
0 Related Data-Fields
There are no related data-fields
0 Resources
There are no matching Resources
