Data
87,996 items of data are available, covering 83,313 participants.
Defined-instances run from 2 to 3, labelled using Instancing
2.
Units of measurement are mm2.
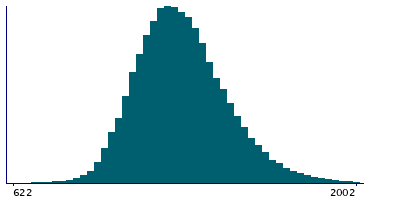
| Maximum | 2379 |
| Decile 9 | 1538 |
| Decile 8 | 1442 |
| Decile 7 | 1378 |
| Decile 6 | 1327 |
| Median | 1282 |
| Decile 4 | 1238 |
| Decile 3 | 1194 |
| Decile 2 | 1144 |
| Decile 1 | 1079 |
| Minimum | 502 |
|
|
- Mean = 1297.59
- Std.dev = 184.349
- 4 items below graph minimum of 620
- 136 items above graph maximum of 1997
|
2 Instances
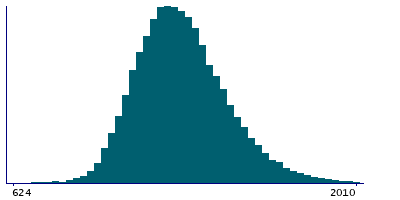
Instance 2 : Imaging visit (2014+)
83,241 participants, 83,241 items
| Maximum | 2379 |
| Decile 9 | 1537 |
| Decile 8 | 1441 |
| Decile 7 | 1377 |
| Decile 6 | 1327 |
| Median | 1281 |
| Decile 4 | 1237 |
| Decile 3 | 1193 |
| Decile 2 | 1144 |
| Decile 1 | 1079 |
| Minimum | 502 |
|
|
- Mean = 1297.09
- Std.dev = 184.281
- 4 items below graph minimum of 621
- 127 items above graph maximum of 1995
|
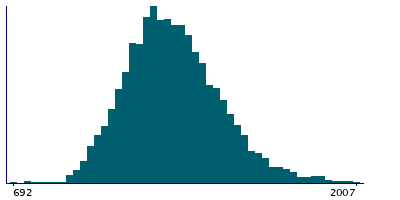
Instance 3 : First repeat imaging visit (2019+)
4,755 participants, 4,755 items
| Maximum | 2164 |
| Decile 9 | 1546 |
| Decile 8 | 1452 |
| Decile 7 | 1387 |
| Decile 6 | 1337 |
| Median | 1290 |
| Decile 4 | 1244 |
| Decile 3 | 1202 |
| Decile 2 | 1151 |
| Decile 1 | 1085 |
| Minimum | 692 |
|
|
- Mean = 1306.33
- Std.dev = 185.318
- 9 items above graph maximum of 2007
|
Notes
Area of G-postcentral in the right hemisphere generated by parcellation of the white surface using Destrieux (a2009s) parcellation
0 Related Data-Fields
There are no related data-fields
0 Resources
There are no matching Resources
