Data
87,996 items of data are available, covering 83,313 participants.
Defined-instances run from 2 to 3, labelled using Instancing
2.
Units of measurement are mm2.
| Maximum | 3491 |
| Decile 9 | 2106 |
| Decile 8 | 1935 |
| Decile 7 | 1821 |
| Decile 6 | 1731 |
| Median | 1653 |
| Decile 4 | 1579 |
| Decile 3 | 1505 |
| Decile 2 | 1424 |
| Decile 1 | 1323 |
| Minimum | 654 |
|

|
- Mean = 1687.77
- Std.dev = 307.028
- 55 items above graph maximum of 2889
|
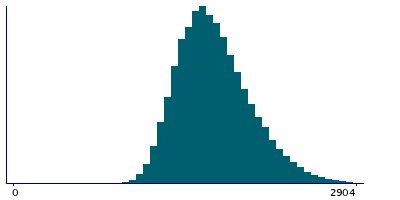
2 Instances
Instance 2 : Imaging visit (2014+)
83,241 participants, 83,241 items
| Maximum | 3491 |
| Decile 9 | 2106 |
| Decile 8 | 1935 |
| Decile 7 | 1820 |
| Decile 6 | 1730 |
| Median | 1652 |
| Decile 4 | 1578 |
| Decile 3 | 1505 |
| Decile 2 | 1423 |
| Decile 1 | 1322 |
| Minimum | 654 |
|
|
- Mean = 1687.08
- Std.dev = 307.218
- 52 items above graph maximum of 2890
|
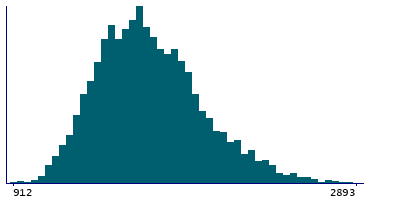
Instance 3 : First repeat imaging visit (2019+)
4,755 participants, 4,755 items
| Maximum | 3094 |
| Decile 9 | 2114.5 |
| Decile 8 | 1939 |
| Decile 7 | 1839 |
| Decile 6 | 1747 |
| Median | 1666 |
| Decile 4 | 1597 |
| Decile 3 | 1516 |
| Decile 2 | 1438 |
| Decile 1 | 1336 |
| Minimum | 912 |
|
|
- Mean = 1699.85
- Std.dev = 303.431
- 2 items above graph maximum of 2893
|
Notes
Area of S-calcarine in the right hemisphere generated by parcellation of the white surface using Destrieux (a2009s) parcellation
0 Related Data-Fields
There are no related data-fields
0 Resources
There are no matching Resources
