Data
87,992 items of data are available, covering 83,309 participants.
Defined-instances run from 2 to 3, labelled using Instancing
2.
Units of measurement are mm2.
| Maximum | 876 |
| Decile 9 | 441 |
| Decile 8 | 386 |
| Decile 7 | 348 |
| Decile 6 | 316 |
| Median | 287 |
| Decile 4 | 259 |
| Decile 3 | 232 |
| Decile 2 | 202 |
| Decile 1 | 167 |
| Minimum | 4 |
|
|
- Mean = 296.725
- Std.dev = 106.847
- 34 items above graph maximum of 715
|
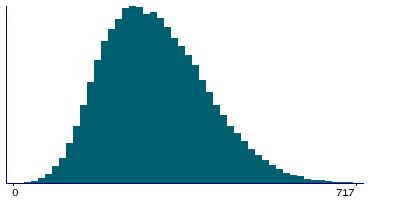
2 Instances
Instance 2 : Imaging visit (2014+)
83,237 participants, 83,237 items
| Maximum | 876 |
| Decile 9 | 441 |
| Decile 8 | 386 |
| Decile 7 | 348 |
| Decile 6 | 316 |
| Median | 287 |
| Decile 4 | 259 |
| Decile 3 | 232 |
| Decile 2 | 202 |
| Decile 1 | 167 |
| Minimum | 4 |
|

|
- Mean = 296.739
- Std.dev = 106.887
- 32 items above graph maximum of 715
|
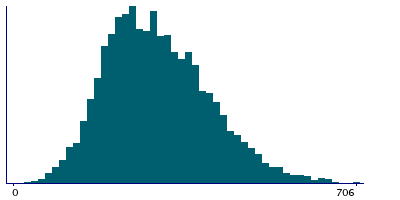
Instance 3 : First repeat imaging visit (2019+)
4,755 participants, 4,755 items
| Maximum | 751 |
| Decile 9 | 438 |
| Decile 8 | 384 |
| Decile 7 | 348 |
| Decile 6 | 315 |
| Median | 286 |
| Decile 4 | 257 |
| Decile 3 | 231 |
| Decile 2 | 204 |
| Decile 1 | 170 |
| Minimum | 23 |
|
|
- Mean = 296.468
- Std.dev = 106.15
- 2 items above graph maximum of 706
|
Notes
Area of S-interm-prim-Jensen in the right hemisphere generated by parcellation of the white surface using Destrieux (a2009s) parcellation
0 Related Data-Fields
There are no related data-fields
0 Resources
There are no matching Resources
