Data
87,995 items of data are available, covering 83,312 participants.
Defined-instances run from 2 to 3, labelled using Instancing
2.
Units of measurement are mm2.
| Maximum | 467 |
| Decile 9 | 275 |
| Decile 8 | 250 |
| Decile 7 | 233 |
| Decile 6 | 219 |
| Median | 206 |
| Decile 4 | 193 |
| Decile 3 | 180 |
| Decile 2 | 164 |
| Decile 1 | 143 |
| Minimum | 0 |
|

|
- Mean = 207.635
- Std.dev = 52.0524
- 40 items above graph maximum of 407
|
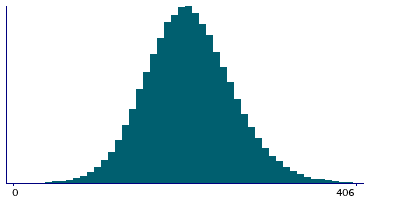
2 Instances
Instance 2 : Imaging visit (2014+)
83,240 participants, 83,240 items
| Maximum | 467 |
| Decile 9 | 274 |
| Decile 8 | 250 |
| Decile 7 | 233 |
| Decile 6 | 218 |
| Median | 206 |
| Decile 4 | 193 |
| Decile 3 | 180 |
| Decile 2 | 164 |
| Decile 1 | 143 |
| Minimum | 0 |
|
|
- Mean = 207.58
- Std.dev = 52.0024
- 41 items above graph maximum of 405
|
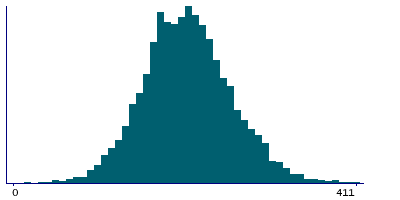
Instance 3 : First repeat imaging visit (2019+)
4,755 participants, 4,755 items
| Maximum | 435 |
| Decile 9 | 277.5 |
| Decile 8 | 251 |
| Decile 7 | 234 |
| Decile 6 | 220 |
| Median | 207 |
| Decile 4 | 193 |
| Decile 3 | 180 |
| Decile 2 | 166 |
| Decile 1 | 144 |
| Minimum | 19 |
|
|
- Mean = 208.598
- Std.dev = 52.9109
- 3 items above graph maximum of 411
|
Notes
Area of S-temporal-transverse in the right hemisphere generated by parcellation of the white surface using Destrieux (a2009s) parcellation
0 Related Data-Fields
There are no related data-fields
0 Resources
There are no matching Resources
