Data
87,996 items of data are available, covering 83,313 participants.
Defined-instances run from 2 to 3, labelled using Instancing
2.
Units of measurement are mm.
| Maximum | 3.973 |
| Decile 9 | 2.914 |
| Decile 8 | 2.827 |
| Decile 7 | 2.765 |
| Decile 6 | 2.713 |
| Median | 2.665 |
| Decile 4 | 2.616 |
| Decile 3 | 2.564 |
| Decile 2 | 2.499 |
| Decile 1 | 2.405 |
| Minimum | 1.182 |
|

|
- Mean = 2.6618
- Std.dev = 0.204402
- 51 items below graph minimum of 1.896
- 53 items above graph maximum of 3.423
|
2 Instances
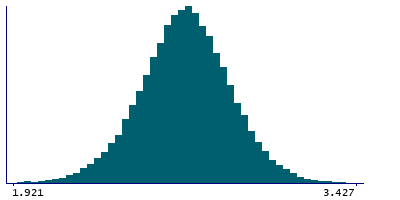
Instance 2 : Imaging visit (2014+)
83,241 participants, 83,241 items
| Maximum | 3.973 |
| Decile 9 | 2.914 |
| Decile 8 | 2.827 |
| Decile 7 | 2.764 |
| Decile 6 | 2.712 |
| Median | 2.664 |
| Decile 4 | 2.615 |
| Decile 3 | 2.562 |
| Decile 2 | 2.497 |
| Decile 1 | 2.404 |
| Minimum | 1.559 |
|
|
- Mean = 2.66085
- Std.dev = 0.204967
- 46 items below graph minimum of 1.894
- 49 items above graph maximum of 3.424
|
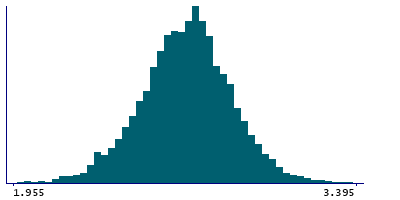
Instance 3 : First repeat imaging visit (2019+)
4,755 participants, 4,755 items
| Maximum | 3.531 |
| Decile 9 | 2.915 |
| Decile 8 | 2.833 |
| Decile 7 | 2.772 |
| Decile 6 | 2.728 |
| Median | 2.686 |
| Decile 4 | 2.637 |
| Decile 3 | 2.587 |
| Decile 2 | 2.53 |
| Decile 1 | 2.435 |
| Minimum | 1.182 |
|
|
- Mean = 2.67843
- Std.dev = 0.193491
- 6 items below graph minimum of 1.955
- 3 items above graph maximum of 3.395
|
Notes
Mean thickness of G+S-transv-frontopol in the right hemisphere generated by parcellation of the white surface using Destrieux (a2009s) parcellation
0 Related Data-Fields
There are no related data-fields
0 Resources
There are no matching Resources
