Data
87,996 items of data are available, covering 83,313 participants.
Defined-instances run from 2 to 3, labelled using Instancing
2.
Units of measurement are mm.
| Maximum | 3.493 |
| Decile 9 | 2.98 |
| Decile 8 | 2.913 |
| Decile 7 | 2.864 |
| Decile 6 | 2.821 |
| Median | 2.78 |
| Decile 4 | 2.736 |
| Decile 3 | 2.689 |
| Decile 2 | 2.63 |
| Decile 1 | 2.546 |
| Minimum | 1.302 |
|

|
- Mean = 2.76963
- Std.dev = 0.17158
- 52 items below graph minimum of 2.112
- 4 items above graph maximum of 3.414
|
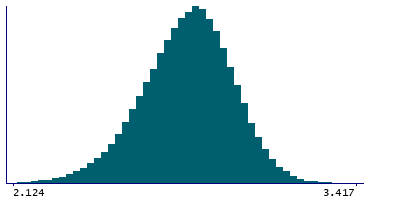
2 Instances
Instance 2 : Imaging visit (2014+)
83,241 participants, 83,241 items
| Maximum | 3.493 |
| Decile 9 | 2.98 |
| Decile 8 | 2.913 |
| Decile 7 | 2.863 |
| Decile 6 | 2.821 |
| Median | 2.779 |
| Decile 4 | 2.735 |
| Decile 3 | 2.688 |
| Decile 2 | 2.629 |
| Decile 1 | 2.545 |
| Minimum | 1.302 |
|
|
- Mean = 2.76889
- Std.dev = 0.172032
- 51 items below graph minimum of 2.11
- 3 items above graph maximum of 3.415
|
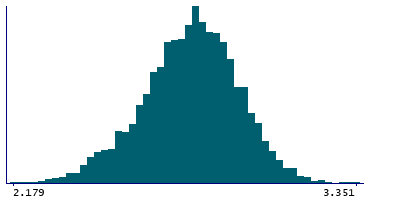
Instance 3 : First repeat imaging visit (2019+)
4,755 participants, 4,755 items
| Maximum | 3.351 |
| Decile 9 | 2.982 |
| Decile 8 | 2.918 |
| Decile 7 | 2.873 |
| Decile 6 | 2.83 |
| Median | 2.793 |
| Decile 4 | 2.751 |
| Decile 3 | 2.705 |
| Decile 2 | 2.651 |
| Decile 1 | 2.565 |
| Minimum | 2.179 |
|
|
- Mean = 2.78264
- Std.dev = 0.162912
|
Notes
Mean thickness of G+S-cingul-Mid-Post in the right hemisphere generated by parcellation of the white surface using Destrieux (a2009s) parcellation
0 Related Data-Fields
There are no related data-fields
0 Resources
There are no matching Resources
