Data
87,996 items of data are available, covering 83,313 participants.
Defined-instances run from 2 to 3, labelled using Instancing
2.
Units of measurement are mm.
| Maximum | 3.064 |
| Decile 9 | 2.486 |
| Decile 8 | 2.407 |
| Decile 7 | 2.351 |
| Decile 6 | 2.303 |
| Median | 2.257 |
| Decile 4 | 2.212 |
| Decile 3 | 2.162 |
| Decile 2 | 2.103 |
| Decile 1 | 2.022 |
| Minimum | 1.154 |
|
|
- Mean = 2.25493
- Std.dev = 0.181723
- 20 items below graph minimum of 1.558
- 5 items above graph maximum of 2.95
|
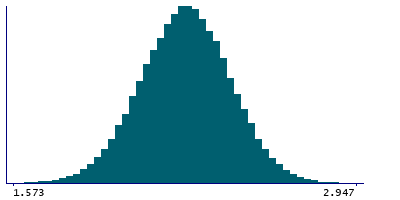
2 Instances
Instance 2 : Imaging visit (2014+)
83,241 participants, 83,241 items
| Maximum | 3.064 |
| Decile 9 | 2.486 |
| Decile 8 | 2.406 |
| Decile 7 | 2.35 |
| Decile 6 | 2.302 |
| Median | 2.257 |
| Decile 4 | 2.211 |
| Decile 3 | 2.161 |
| Decile 2 | 2.103 |
| Decile 1 | 2.021 |
| Minimum | 1.154 |
|

|
- Mean = 2.25432
- Std.dev = 0.181998
- 19 items below graph minimum of 1.556
- 5 items above graph maximum of 2.951
|
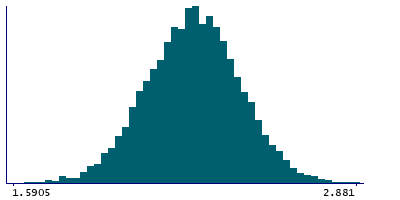
Instance 3 : First repeat imaging visit (2019+)
4,755 participants, 4,755 items
| Maximum | 2.881 |
| Decile 9 | 2.4895 |
| Decile 8 | 2.413 |
| Decile 7 | 2.359 |
| Decile 6 | 2.314 |
| Median | 2.268 |
| Decile 4 | 2.226 |
| Decile 3 | 2.176 |
| Decile 2 | 2.117 |
| Decile 1 | 2.04 |
| Minimum | 1.221 |
|
|
- Mean = 2.26575
- Std.dev = 0.176492
- 1 item below graph minimum of 1.5905
|
Notes
Mean thickness of G-occipital-sup in the right hemisphere generated by parcellation of the white surface using Destrieux (a2009s) parcellation
0 Related Data-Fields
There are no related data-fields
0 Resources
There are no matching Resources
