Data
87,996 items of data are available, covering 83,313 participants.
Defined-instances run from 2 to 3, labelled using Instancing
2.
Units of measurement are mm.
| Maximum | 3.788 |
| Decile 9 | 3.249 |
| Decile 8 | 3.169 |
| Decile 7 | 3.111 |
| Decile 6 | 3.059 |
| Median | 3.008 |
| Decile 4 | 2.956 |
| Decile 3 | 2.899 |
| Decile 2 | 2.829 |
| Decile 1 | 2.727 |
| Minimum | 1.58 |
|

|
- Mean = 2.99566
- Std.dev = 0.207482
- 92 items below graph minimum of 2.205
- 1 item above graph maximum of 3.771
|
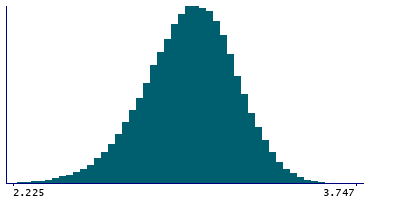
2 Instances
Instance 2 : Imaging visit (2014+)
83,241 participants, 83,241 items
| Maximum | 3.788 |
| Decile 9 | 3.248 |
| Decile 8 | 3.168 |
| Decile 7 | 3.109 |
| Decile 6 | 3.057 |
| Median | 3.006 |
| Decile 4 | 2.954 |
| Decile 3 | 2.897 |
| Decile 2 | 2.827 |
| Decile 1 | 2.724 |
| Minimum | 1.58 |
|
|
- Mean = 2.99406
- Std.dev = 0.2082
- 88 items below graph minimum of 2.2
- 1 item above graph maximum of 3.772
|
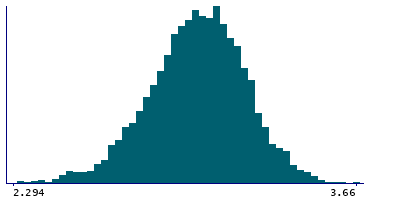
Instance 3 : First repeat imaging visit (2019+)
4,755 participants, 4,755 items
| Maximum | 3.66 |
| Decile 9 | 3.254 |
| Decile 8 | 3.183 |
| Decile 7 | 3.13 |
| Decile 6 | 3.082 |
| Median | 3.0335 |
| Decile 4 | 2.986 |
| Decile 3 | 2.935 |
| Decile 2 | 2.87 |
| Decile 1 | 2.774 |
| Minimum | 1.99 |
|
|
- Mean = 3.02357
- Std.dev = 0.192356
- 5 items below graph minimum of 2.294
|
Notes
Mean thickness of G-oc-temp-lat-fusifor in the right hemisphere generated by parcellation of the white surface using Destrieux (a2009s) parcellation
0 Related Data-Fields
There are no related data-fields
0 Resources
There are no matching Resources
