Data
87,996 items of data are available, covering 83,313 participants.
Defined-instances run from 2 to 3, labelled using Instancing
2.
Units of measurement are mm.
| Maximum | 3.198 |
| Decile 9 | 2.561 |
| Decile 8 | 2.471 |
| Decile 7 | 2.404 |
| Decile 6 | 2.346 |
| Median | 2.291 |
| Decile 4 | 2.235 |
| Decile 3 | 2.173 |
| Decile 2 | 2.101 |
| Decile 1 | 1.995 |
| Minimum | 0.77 |
|

|
- Mean = 2.28354
- Std.dev = 0.22393
- 53 items below graph minimum of 1.429
- 4 items above graph maximum of 3.127
|
2 Instances
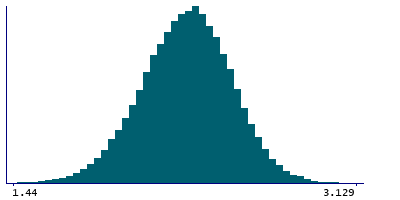
Instance 2 : Imaging visit (2014+)
83,241 participants, 83,241 items
| Maximum | 3.198 |
| Decile 9 | 2.56 |
| Decile 8 | 2.47 |
| Decile 7 | 2.403 |
| Decile 6 | 2.345 |
| Median | 2.29 |
| Decile 4 | 2.234 |
| Decile 3 | 2.172 |
| Decile 2 | 2.099 |
| Decile 1 | 1.993 |
| Minimum | 0.999 |
|
|
- Mean = 2.28237
- Std.dev = 0.224104
- 48 items below graph minimum of 1.426
- 3 items above graph maximum of 3.127
|
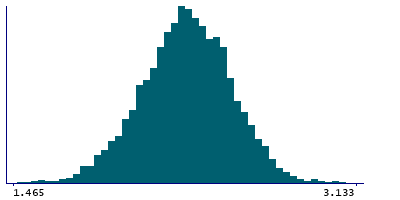
Instance 3 : First repeat imaging visit (2019+)
4,755 participants, 4,755 items
| Maximum | 3.184 |
| Decile 9 | 2.577 |
| Decile 8 | 2.486 |
| Decile 7 | 2.422 |
| Decile 6 | 2.362 |
| Median | 2.308 |
| Decile 4 | 2.258 |
| Decile 3 | 2.198 |
| Decile 2 | 2.125 |
| Decile 1 | 2.021 |
| Minimum | 0.77 |
|
|
- Mean = 2.30397
- Std.dev = 0.219858
- 3 items below graph minimum of 1.465
- 1 item above graph maximum of 3.133
|
Notes
Mean thickness of G-postcentral in the right hemisphere generated by parcellation of the white surface using Destrieux (a2009s) parcellation
0 Related Data-Fields
There are no related data-fields
0 Resources
There are no matching Resources
