Data
87,996 items of data are available, covering 83,313 participants.
Defined-instances run from 2 to 3, labelled using Instancing
2.
Units of measurement are mm.
| Maximum | 3.74 |
| Decile 9 | 3.101 |
| Decile 8 | 3.012 |
| Decile 7 | 2.946 |
| Decile 6 | 2.888 |
| Median | 2.835 |
| Decile 4 | 2.778 |
| Decile 3 | 2.717 |
| Decile 2 | 2.644 |
| Decile 1 | 2.537 |
| Minimum | 1.307 |
|

|
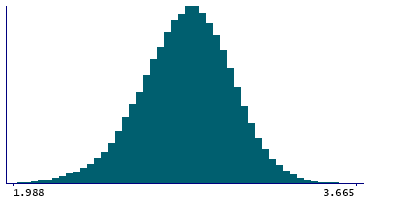
- Mean = 2.82519
- Std.dev = 0.223415
- 53 items below graph minimum of 1.973
- 3 items above graph maximum of 3.665
|
2 Instances
Instance 2 : Imaging visit (2014+)
83,241 participants, 83,241 items
| Maximum | 3.74 |
| Decile 9 | 3.1 |
| Decile 8 | 3.011 |
| Decile 7 | 2.945 |
| Decile 6 | 2.888 |
| Median | 2.834 |
| Decile 4 | 2.777 |
| Decile 3 | 2.716 |
| Decile 2 | 2.643 |
| Decile 1 | 2.536 |
| Minimum | 1.307 |
|
|
- Mean = 2.82417
- Std.dev = 0.223961
- 52 items below graph minimum of 1.972
- 3 items above graph maximum of 3.664
|
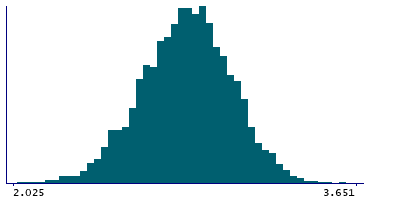
Instance 3 : First repeat imaging visit (2019+)
4,755 participants, 4,755 items
| Maximum | 3.655 |
| Decile 9 | 3.109 |
| Decile 8 | 3.023 |
| Decile 7 | 2.957 |
| Decile 6 | 2.903 |
| Median | 2.848 |
| Decile 4 | 2.797 |
| Decile 3 | 2.734 |
| Decile 2 | 2.663 |
| Decile 1 | 2.567 |
| Minimum | 1.823 |
|
|
- Mean = 2.84311
- Std.dev = 0.212823
- 2 items below graph minimum of 2.025
- 1 item above graph maximum of 3.651
|
Notes
Mean thickness of G-temp-sup-Plan-tempo in the right hemisphere generated by parcellation of the white surface using Destrieux (a2009s) parcellation
0 Related Data-Fields
There are no related data-fields
0 Resources
There are no matching Resources
