Data
87,960 items of data are available, covering 83,282 participants.
Defined-instances run from 2 to 3, labelled using Instancing
2.
Units of measurement are mm.
| Maximum | 4.568 |
| Decile 9 | 2.99 |
| Decile 8 | 2.862 |
| Decile 7 | 2.78 |
| Decile 6 | 2.713 |
| Median | 2.652 |
| Decile 4 | 2.594 |
| Decile 3 | 2.533 |
| Decile 2 | 2.461 |
| Decile 1 | 2.36 |
| Minimum | 0 |
|
|
- Mean = 2.66626
- Std.dev = 0.259312
- 34 items below graph minimum of 1.73
- 167 items above graph maximum of 3.62
|
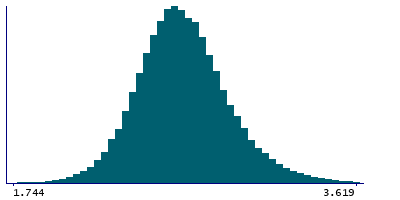
2 Instances
Instance 2 : Imaging visit (2014+)
83,210 participants, 83,210 items
| Maximum | 4.568 |
| Decile 9 | 2.99 |
| Decile 8 | 2.862 |
| Decile 7 | 2.779 |
| Decile 6 | 2.713 |
| Median | 2.651 |
| Decile 4 | 2.593 |
| Decile 3 | 2.532 |
| Decile 2 | 2.459 |
| Decile 1 | 2.359 |
| Minimum | 0 |
|

|
- Mean = 2.66539
- Std.dev = 0.26009
- 31 items below graph minimum of 1.728
- 160 items above graph maximum of 3.621
|
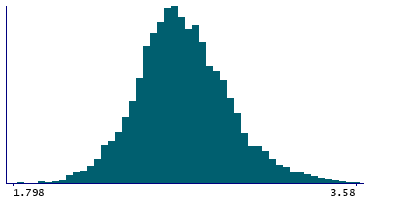
Instance 3 : First repeat imaging visit (2019+)
4,750 participants, 4,750 items
| Maximum | 4.06 |
| Decile 9 | 2.986 |
| Decile 8 | 2.872 |
| Decile 7 | 2.788 |
| Decile 6 | 2.726 |
| Median | 2.665 |
| Decile 4 | 2.611 |
| Decile 3 | 2.553 |
| Decile 2 | 2.488 |
| Decile 1 | 2.392 |
| Minimum | 1.588 |
|
|
- Mean = 2.68153
- Std.dev = 0.244789
- 3 items below graph minimum of 1.798
- 9 items above graph maximum of 3.58
|
Notes
Mean thickness of Lat-Fis-ant-Vertical in the right hemisphere generated by parcellation of the white surface using Destrieux (a2009s) parcellation
0 Related Data-Fields
There are no related data-fields
0 Resources
There are no matching Resources
