Data
87,996 items of data are available, covering 83,313 participants.
Defined-instances run from 2 to 3, labelled using Instancing
2.
Units of measurement are mm.
| Maximum | 4.228 |
| Decile 9 | 3.691 |
| Decile 8 | 3.6 |
| Decile 7 | 3.534 |
| Decile 6 | 3.476 |
| Median | 3.421 |
| Decile 4 | 3.365 |
| Decile 3 | 3.302 |
| Decile 2 | 3.226 |
| Decile 1 | 3.115 |
| Minimum | 1.337 |
|

|
- Mean = 3.40816
- Std.dev = 0.233259
- 221 items below graph minimum of 2.539
|
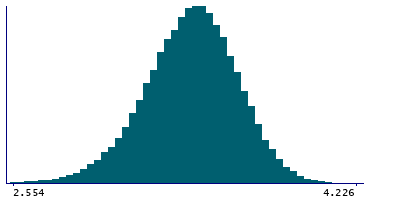
2 Instances
Instance 2 : Imaging visit (2014+)
83,241 participants, 83,241 items
| Maximum | 4.228 |
| Decile 9 | 3.69 |
| Decile 8 | 3.6 |
| Decile 7 | 3.533 |
| Decile 6 | 3.475 |
| Median | 3.42 |
| Decile 4 | 3.363 |
| Decile 3 | 3.3 |
| Decile 2 | 3.225 |
| Decile 1 | 3.113 |
| Minimum | 1.337 |
|
|
- Mean = 3.40694
- Std.dev = 0.233857
- 208 items below graph minimum of 2.536
|
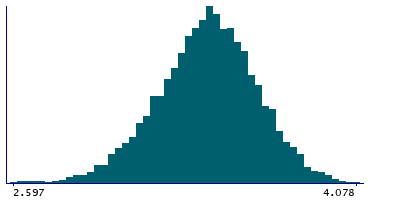
Instance 3 : First repeat imaging visit (2019+)
4,755 participants, 4,755 items
| Maximum | 4.078 |
| Decile 9 | 3.701 |
| Decile 8 | 3.609 |
| Decile 7 | 3.547 |
| Decile 6 | 3.492 |
| Median | 3.4405 |
| Decile 4 | 3.389 |
| Decile 3 | 3.331 |
| Decile 2 | 3.255 |
| Decile 1 | 3.149 |
| Minimum | 1.471 |
|
|
- Mean = 3.42955
- Std.dev = 0.221448
- 13 items below graph minimum of 2.597
|
Notes
Mean thickness of Pole-temporal in the right hemisphere generated by parcellation of the white surface using Destrieux (a2009s) parcellation
0 Related Data-Fields
There are no related data-fields
0 Resources
There are no matching Resources
