Data
87,996 items of data are available, covering 83,313 participants.
Defined-instances run from 2 to 3, labelled using Instancing
2.
Units of measurement are mm.
| Maximum | 3.848 |
| Decile 9 | 2.563 |
| Decile 8 | 2.495 |
| Decile 7 | 2.447 |
| Decile 6 | 2.403 |
| Median | 2.362 |
| Decile 4 | 2.319 |
| Decile 3 | 2.273 |
| Decile 2 | 2.219 |
| Decile 1 | 2.14 |
| Minimum | 1.458 |
|
|
- Mean = 2.35531
- Std.dev = 0.166734
- 45 items below graph minimum of 1.717
- 4 items above graph maximum of 2.986
|
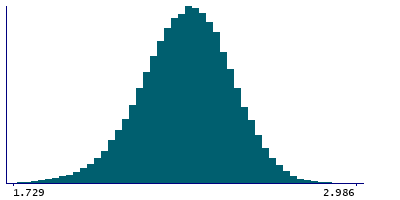
2 Instances
Instance 2 : Imaging visit (2014+)
83,241 participants, 83,241 items
| Maximum | 3.848 |
| Decile 9 | 2.563 |
| Decile 8 | 2.495 |
| Decile 7 | 2.446 |
| Decile 6 | 2.402 |
| Median | 2.361 |
| Decile 4 | 2.318 |
| Decile 3 | 2.273 |
| Decile 2 | 2.218 |
| Decile 1 | 2.139 |
| Minimum | 1.512 |
|

|
- Mean = 2.3544
- Std.dev = 0.167129
- 39 items below graph minimum of 1.715
- 4 items above graph maximum of 2.987
|
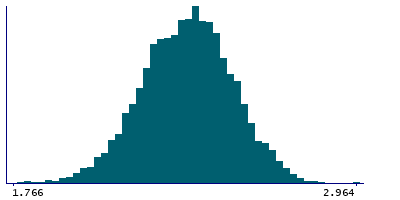
Instance 3 : First repeat imaging visit (2019+)
4,755 participants, 4,755 items
| Maximum | 2.964 |
| Decile 9 | 2.57 |
| Decile 8 | 2.504 |
| Decile 7 | 2.458 |
| Decile 6 | 2.416 |
| Median | 2.376 |
| Decile 4 | 2.335 |
| Decile 3 | 2.288 |
| Decile 2 | 2.24 |
| Decile 1 | 2.168 |
| Minimum | 1.458 |
|
|
- Mean = 2.3713
- Std.dev = 0.158797
- 3 items below graph minimum of 1.766
|
Notes
Mean thickness of S-postcentral in the right hemisphere generated by parcellation of the white surface using Destrieux (a2009s) parcellation
0 Related Data-Fields
There are no related data-fields
0 Resources
There are no matching Resources
