Data
87,996 items of data are available, covering 83,313 participants.
Defined-instances run from 2 to 3, labelled using Instancing
2.
Units of measurement are mm.
| Maximum | 3.926 |
| Decile 9 | 2.864 |
| Decile 8 | 2.792 |
| Decile 7 | 2.738 |
| Decile 6 | 2.69 |
| Median | 2.643 |
| Decile 4 | 2.595 |
| Decile 3 | 2.541 |
| Decile 2 | 2.476 |
| Decile 1 | 2.377 |
| Minimum | 0.989 |
|

|
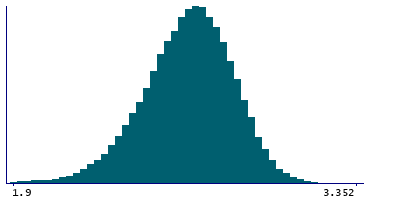
- Mean = 2.62748
- Std.dev = 0.200278
- 400 items below graph minimum of 1.89
- 2 items above graph maximum of 3.351
|
2 Instances
Instance 2 : Imaging visit (2014+)
83,241 participants, 83,241 items
| Maximum | 3.926 |
| Decile 9 | 2.863 |
| Decile 8 | 2.791 |
| Decile 7 | 2.737 |
| Decile 6 | 2.689 |
| Median | 2.642 |
| Decile 4 | 2.594 |
| Decile 3 | 2.539 |
| Decile 2 | 2.474 |
| Decile 1 | 2.375 |
| Minimum | 0.989 |
|
|
- Mean = 2.6263
- Std.dev = 0.200744
- 383 items below graph minimum of 1.887
- 2 items above graph maximum of 3.351
|
Instance 3 : First repeat imaging visit (2019+)
4,755 participants, 4,755 items
| Maximum | 3.301 |
| Decile 9 | 2.877 |
| Decile 8 | 2.807 |
| Decile 7 | 2.7515 |
| Decile 6 | 2.705 |
| Median | 2.661 |
| Decile 4 | 2.617 |
| Decile 3 | 2.563 |
| Decile 2 | 2.503 |
| Decile 1 | 2.414 |
| Minimum | 1.486 |
|

|
- Mean = 2.64811
- Std.dev = 0.190751
- 19 items below graph minimum of 1.951
|
Notes
Mean thickness of S-precentral-sup-part in the right hemisphere generated by parcellation of the white surface using Destrieux (a2009s) parcellation
0 Related Data-Fields
There are no related data-fields
0 Resources
There are no matching Resources
