Data
87,996 items of data are available, covering 83,313 participants.
Defined-instances run from 2 to 3, labelled using Instancing
2.
Units of measurement are mm.
| Maximum | 3.425 |
| Decile 9 | 2.826 |
| Decile 8 | 2.751 |
| Decile 7 | 2.699 |
| Decile 6 | 2.655 |
| Median | 2.615 |
| Decile 4 | 2.573 |
| Decile 3 | 2.528 |
| Decile 2 | 2.475 |
| Decile 1 | 2.401 |
| Minimum | 1.364 |
|
|
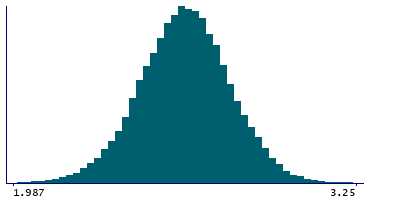
- Mean = 2.61308
- Std.dev = 0.168847
- 39 items below graph minimum of 1.976
- 32 items above graph maximum of 3.251
|
2 Instances
Instance 2 : Imaging visit (2014+)
83,241 participants, 83,241 items
| Maximum | 3.425 |
| Decile 9 | 2.826 |
| Decile 8 | 2.751 |
| Decile 7 | 2.699 |
| Decile 6 | 2.655 |
| Median | 2.614 |
| Decile 4 | 2.572 |
| Decile 3 | 2.527 |
| Decile 2 | 2.474 |
| Decile 1 | 2.4 |
| Minimum | 1.364 |
|

|
- Mean = 2.61237
- Std.dev = 0.169241
- 39 items below graph minimum of 1.974
- 28 items above graph maximum of 3.252
|
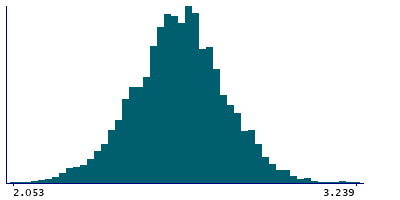
Instance 3 : First repeat imaging visit (2019+)
4,755 participants, 4,755 items
| Maximum | 3.347 |
| Decile 9 | 2.83 |
| Decile 8 | 2.754 |
| Decile 7 | 2.704 |
| Decile 6 | 2.665 |
| Median | 2.627 |
| Decile 4 | 2.589 |
| Decile 3 | 2.549 |
| Decile 2 | 2.493 |
| Decile 1 | 2.421 |
| Minimum | 2.053 |
|
|
- Mean = 2.62551
- Std.dev = 0.161278
- 3 items above graph maximum of 3.239
|
Notes
Mean thickness of S-subparietal in the right hemisphere generated by parcellation of the white surface using Destrieux (a2009s) parcellation
0 Related Data-Fields
There are no related data-fields
0 Resources
There are no matching Resources
