Data
87,996 items of data are available, covering 83,313 participants.
Defined-instances run from 2 to 3, labelled using Instancing
2.
Units of measurement are mm3.
| Maximum | 2135 |
| Decile 9 | 1134 |
| Decile 8 | 1023 |
| Decile 7 | 948 |
| Decile 6 | 886 |
| Median | 830 |
| Decile 4 | 776 |
| Decile 3 | 718 |
| Decile 2 | 649 |
| Decile 1 | 550 |
| Minimum | 10 |
|

|
- Mean = 837.934
- Std.dev = 231.522
- 54 items above graph maximum of 1718
|
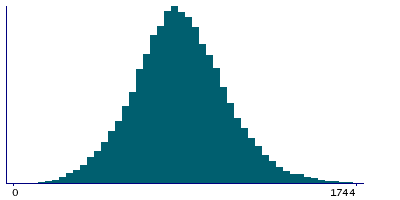
2 Instances
Instance 2 : Imaging visit (2014+)
83,241 participants, 83,241 items
| Maximum | 2135 |
| Decile 9 | 1133 |
| Decile 8 | 1022 |
| Decile 7 | 947 |
| Decile 6 | 885 |
| Median | 829 |
| Decile 4 | 775 |
| Decile 3 | 717 |
| Decile 2 | 648 |
| Decile 1 | 548 |
| Minimum | 10 |
|
|
- Mean = 836.995
- Std.dev = 231.551
- 48 items above graph maximum of 1718
|
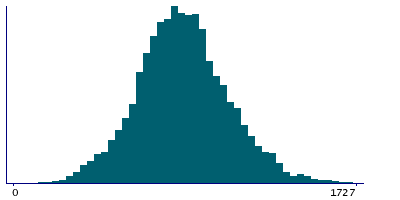
Instance 3 : First repeat imaging visit (2019+)
4,755 participants, 4,755 items
| Maximum | 1984 |
| Decile 9 | 1149.5 |
| Decile 8 | 1039 |
| Decile 7 | 958 |
| Decile 6 | 901 |
| Median | 846 |
| Decile 4 | 792 |
| Decile 3 | 733.5 |
| Decile 2 | 670 |
| Decile 1 | 572 |
| Minimum | 142 |
|
|
- Mean = 854.377
- Std.dev = 230.389
- 6 items above graph maximum of 1727
|
Notes
Volume of G-subcallosal in the right hemisphere generated by parcellation of the white surface using Destrieux (a2009s) parcellation
0 Related Data-Fields
There are no related data-fields
0 Resources
There are no matching Resources
