Data
501,976 items of data are available, covering 477,948 participants.
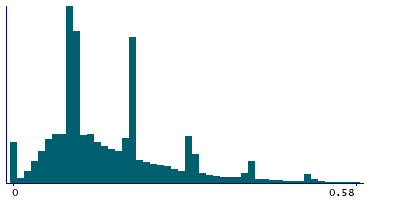
Defined-instances run from 0 to 2, labelled using Instancing
2.
Units of measurement are 10^9 cells/Litre.
| Maximum | 9.6 |
| Decile 9 | 0.32 |
| Decile 8 | 0.24 |
| Decile 7 | 0.2 |
| Decile 6 | 0.18 |
| Median | 0.14 |
| Decile 4 | 0.1 |
| Decile 3 | 0.1 |
| Decile 2 | 0.09 |
| Decile 1 | 0.06 |
| Minimum | 0 |
|
|
- Mean = 0.174491
- Std.dev = 0.138188
- 7933 items above graph maximum of 0.58
|
3 Instances
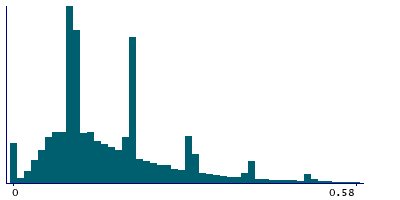
Instance 0 : Initial assessment visit (2006-2010) at which participants were recruited and consent given
476,750 participants, 476,750 items
| Maximum | 9.6 |
| Decile 9 | 0.32 |
| Decile 8 | 0.25 |
| Decile 7 | 0.2 |
| Decile 6 | 0.18 |
| Median | 0.14 |
| Decile 4 | 0.1 |
| Decile 3 | 0.1 |
| Decile 2 | 0.09 |
| Decile 1 | 0.06 |
| Minimum | 0 |
|
|
- Mean = 0.174879
- Std.dev = 0.138569
- 7584 items above graph maximum of 0.58
|
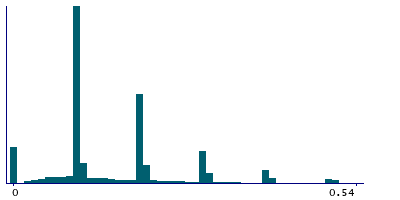
Instance 1 : First repeat assessment visit (2012-13)
19,378 participants, 19,378 items
| Maximum | 2.9 |
| Decile 9 | 0.3 |
| Decile 8 | 0.2 |
| Decile 7 | 0.2 |
| Decile 6 | 0.2 |
| Median | 0.1 |
| Decile 4 | 0.1 |
| Decile 3 | 0.1 |
| Decile 2 | 0.1 |
| Decile 1 | 0.06 |
| Minimum | 0 |
|
|
- Mean = 0.165104
- Std.dev = 0.127406
- 264 items above graph maximum of 0.54
|
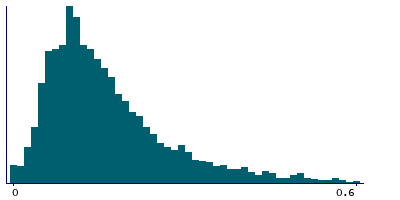
Instance 2 : Imaging visit (2014+)
5,848 participants, 5,848 items
| Maximum | 3.84 |
| Decile 9 | 0.33 |
| Decile 8 | 0.24 |
| Decile 7 | 0.2 |
| Decile 6 | 0.16 |
| Median | 0.14 |
| Decile 4 | 0.12 |
| Decile 3 | 0.1 |
| Decile 2 | 0.08 |
| Decile 1 | 0.06 |
| Minimum | 0 |
|
|
- Mean = 0.173918
- Std.dev = 0.140258
- 86 items above graph maximum of 0.6
|
Notes
Result of "Eosinophils Number" assay, performed on blood sample, obtained from UK Biobank assessment centre visit. Eosinophils count is the proportion of ( eosinophils / 100 ) x white blood cell count.
4 Related Data-Fields
| Field ID | Description | Relationship |
|---|
| 30154 | Eosinophill count acquisition route | Field 30154 is the data route used to acquire the result in Current Field |
| 30152 | Eosinophill count acquisition time | Field 30152 is the original acquisition time of the sample generating the result in Current Field. |
| 30153 | Eosinophill count device ID | Field 30153 is the ID of the device user to generate the result in Current Field |
| 30151 | Eosinophill count freeze-thaw cycles | Field 30151 is the number of freeze-thaw cycles a sample underwent before generating the result in Current Field. |
1 Application
| Application ID | Title |
|---|
| 45925 | Risk Factors, Biomarkers and Impact of Major Vision-Threatening Eye Diseases |

