Data
494,158 items of data are available, covering 470,771 participants.
Defined-instances run from 0 to 2, labelled using Instancing
2.
Units of measurement are percent.
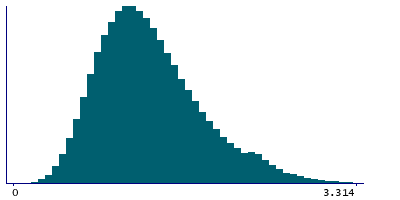
| Maximum | 90.909 |
| Decile 9 | 2.027 |
| Decile 8 | 1.719 |
| Decile 7 | 1.525 |
| Decile 6 | 1.379 |
| Median | 1.25 |
| Decile 4 | 1.133 |
| Decile 3 | 1.02 |
| Decile 2 | 0.894 |
| Decile 1 | 0.74 |
| Minimum | 0 |
|
|
- Mean = 1.34377
- Std.dev = 0.876023
- 1772 items above graph maximum of 3.314
|
3 Instances
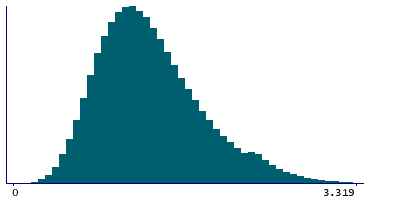
Instance 0 : Initial assessment visit (2006-2010) at which participants were recruited and consent given
469,332 participants, 469,332 items
| Maximum | 90.909 |
| Decile 9 | 2.032 |
| Decile 8 | 1.725 |
| Decile 7 | 1.53 |
| Decile 6 | 1.382 |
| Median | 1.258 |
| Decile 4 | 1.14 |
| Decile 3 | 1.023 |
| Decile 2 | 0.9 |
| Decile 1 | 0.745 |
| Minimum | 0 |
|
|
- Mean = 1.35035
- Std.dev = 0.890758
- 1703 items above graph maximum of 3.319
|
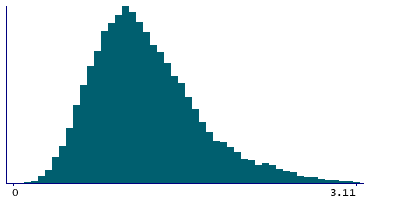
Instance 1 : First repeat assessment visit (2012-13)
19,286 participants, 19,286 items
| Maximum | 11.03 |
| Decile 9 | 1.88 |
| Decile 8 | 1.57 |
| Decile 7 | 1.4 |
| Decile 6 | 1.2595 |
| Median | 1.13 |
| Decile 4 | 1.03 |
| Decile 3 | 0.92 |
| Decile 2 | 0.8 |
| Decile 1 | 0.65 |
| Minimum | 0.09 |
|
|
- Mean = 1.21538
- Std.dev = 0.514953
- 78 items above graph maximum of 3.11
|
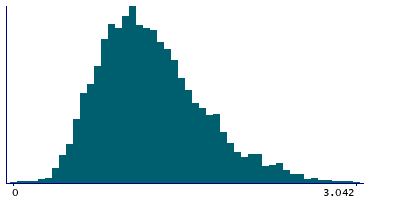
Instance 2 : Imaging visit (2014+)
5,540 participants, 5,540 items
| Maximum | 5.042 |
| Decile 9 | 1.862 |
| Decile 8 | 1.601 |
| Decile 7 | 1.42 |
| Decile 6 | 1.285 |
| Median | 1.168 |
| Decile 4 | 1.054 |
| Decile 3 | 0.946 |
| Decile 2 | 0.829 |
| Decile 1 | 0.681 |
| Minimum | 0.033 |
|
|
- Mean = 1.23369
- Std.dev = 0.487083
- 21 items above graph maximum of 3.043
|
Notes
Result of "Reticulocytes Percentage" assay, performed on blood sample, obtained from UK Biobank assessment centre visit. Reticulocytes (Percentage) is the number of reticulocytes as a percentage of red blood cells.
4 Related Data-Fields
| Field ID | Description | Relationship |
|---|
| 30244 | Reticulocyte percentage acquisition ... | Field 30244 is the data route used to acquire the result in Current Field |
| 30242 | Reticulocyte percentage acquisition time | Field 30242 is the original acquisition time of the sample generating the result in Current Field. |
| 30243 | Reticulocyte percentage device ID | Field 30243 is the ID of the device user to generate the result in Current Field |
| 30241 | Reticulocyte percentage freeze-thaw ... | Field 30241 is the number of freeze-thaw cycles a sample underwent before generating the result in Current Field. |
1 Application
| Application ID | Title |
|---|
| 45925 | Risk Factors, Biomarkers and Impact of Major Vision-Threatening Eye Diseases |

