Data
68,033 items of data are available, covering 64,317 participants.
Defined-instances run from 2 to 3, labelled using Instancing
2.
Units of measurement are Z.
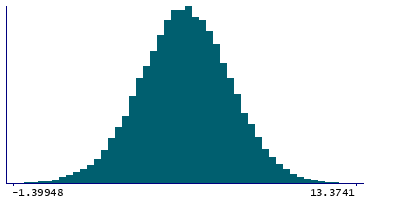
| Maximum | 14.8055 |
| Decile 9 | 8.27341 |
| Decile 8 | 7.41808 |
| Decile 7 | 6.81929 |
| Decile 6 | 6.28958 |
| Median | 5.81503 |
| Decile 4 | 5.33885 |
| Decile 3 | 4.83347 |
| Decile 2 | 4.23163 |
| Decile 1 | 3.4042 |
| Minimum | -4.72607 |
|

|
- Mean = 5.82696
- Std.dev = 1.91072
- 7 items below graph minimum of -1.46501
- 6 items above graph maximum of 13.1426
|
2 Instances
Instance 2 : Imaging visit (2014+)
63,839 participants, 63,839 items
| Maximum | 13.575 |
| Decile 9 | 8.2563 |
| Decile 8 | 7.40005 |
| Decile 7 | 6.7969 |
| Decile 6 | 6.26775 |
| Median | 5.79407 |
| Decile 4 | 5.3192 |
| Decile 3 | 4.81356 |
| Decile 2 | 4.21281 |
| Decile 1 | 3.38625 |
| Minimum | -4.72607 |
|
|
- Mean = 5.80792
- Std.dev = 1.91046
- 7 items below graph minimum of -1.48379
- 5 items above graph maximum of 13.1263
|
Instance 3 : First repeat imaging visit (2019+)
4,194 participants, 4,194 items
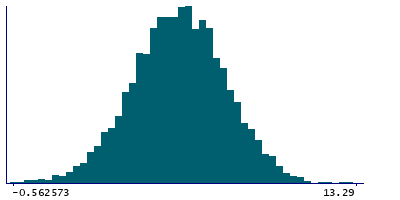
| Maximum | 14.8055 |
| Decile 9 | 8.5019 |
| Decile 8 | 7.6976 |
| Decile 7 | 7.14095 |
| Decile 6 | 6.60915 |
| Median | 6.14827 |
| Decile 4 | 5.64553 |
| Decile 3 | 5.15974 |
| Decile 2 | 4.55466 |
| Decile 1 | 3.71377 |
| Minimum | -0.562573 |
|
|
- Mean = 6.11687
- Std.dev = 1.89123
- 1 item above graph maximum of 13.29
|
Notes
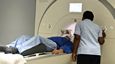
90th percentile of the z-statistic (in group-defined mask) for faces-shapes contrast (in task fMRI data, using cortical surface analysis)
1 Related Data-Field
| Field ID | Description | Relationship |
|---|
| 25766 | 90th percentile of z-statistic (in g ... | Field 25766 is an analogue for Current Field |