Data
68,033 items of data are available, covering 64,317 participants.
Defined-instances run from 2 to 3, labelled using Instancing
2.
Units of measurement are %.
| Maximum | 722.434 |
| Decile 9 | 78.1394 |
| Decile 8 | 65.0148 |
| Decile 7 | 57.5262 |
| Decile 6 | 51.9257 |
| Median | 47.3131 |
| Decile 4 | 43.1938 |
| Decile 3 | 39.185 |
| Decile 2 | 34.9447 |
| Decile 1 | 29.6983 |
| Minimum | -30.3255 |
|

|
- Mean = 51.7949
- Std.dev = 23.3862
- 2 items below graph minimum of -18.7429
- 801 items above graph maximum of 126.581
|
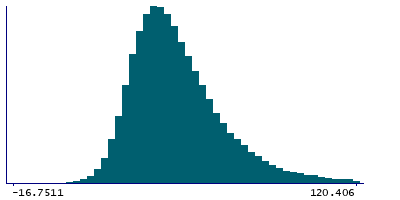
2 Instances
Instance 2 : Imaging visit (2014+)
63,839 participants, 63,839 items
| Maximum | 722.434 |
| Decile 9 | 78.4984 |
| Decile 8 | 65.2765 |
| Decile 7 | 57.7091 |
| Decile 6 | 52.099 |
| Median | 47.4351 |
| Decile 4 | 43.3072 |
| Decile 3 | 39.2481 |
| Decile 2 | 34.9916 |
| Decile 1 | 29.7386 |
| Minimum | -30.3255 |
|
|
- Mean = 51.9656
- Std.dev = 23.5353
- 2 items below graph minimum of -19.0213
- 756 items above graph maximum of 127.258
|
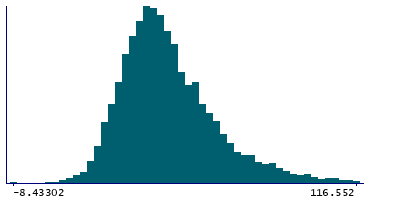
Instance 3 : First repeat imaging visit (2019+)
4,194 participants, 4,194 items
| Maximum | 312.667 |
| Decile 9 | 72.746 |
| Decile 8 | 61.3246 |
| Decile 7 | 54.6687 |
| Decile 6 | 49.4482 |
| Median | 45.3848 |
| Decile 4 | 41.8284 |
| Decile 3 | 38.2676 |
| Decile 2 | 34.241 |
| Decile 1 | 28.9395 |
| Minimum | -8.43302 |
|
|
- Mean = 49.1977
- Std.dev = 20.8153
- 44 items above graph maximum of 116.552
|
Notes
90th percentile of the BOLD effect (in group-defined amygdala activation mask) for faces-shapes contrast (in task fMRI data, using cortical surface analysis)
1 Related Data-Field
| Field ID | Description | Relationship |
|---|
| 25767 | 90th percentile of BOLD effect (in g ... | Field 25767 is an analogue for Current Field |