Data
813,064 items of data are available, covering 90,855 participants.
Defined-instances run from 0 to 3, labelled using Instancing
2.
Array indices run from 0 to 15.
Units of measurement are milliseconds.
| Maximum | 4.83727e+06 |
| Decile 9 | 11996 |
| Decile 8 | 8844 |
| Decile 7 | 7317 |
| Decile 6 | 6333 |
| Median | 5610 |
| Decile 4 | 5016 |
| Decile 3 | 4493 |
| Decile 2 | 3984 |
| Decile 1 | 3422 |
| Minimum | 920 |
|

|
- There are 12885 distinct values.
- Mean = 7172.36
- Std.dev = 8291.88
- 21642 items above graph maximum of 20570
|
3 Instances
Instance 0 : Initial assessment visit (2006-2010) at which participants were recruited and consent given
51,604 participants, 418,884 items
| Maximum | 4.83727e+06 |
| Decile 9 | 12375 |
| Decile 8 | 9063 |
| Decile 7 | 7469 |
| Decile 6 | 6438 |
| Median | 5703 |
| Decile 4 | 5094 |
| Decile 3 | 4547 |
| Decile 2 | 4031 |
| Decile 1 | 3453 |
| Minimum | 1000 |
|

|
- There are 7020 distinct values.
- Mean = 7375.03
- Std.dev = 10201.1
- 11569 items above graph maximum of 21297
|
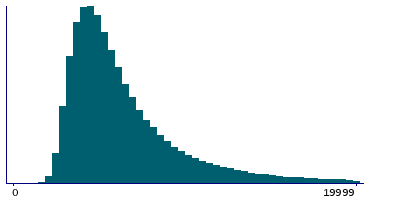
Instance 2 : Imaging visit (2014+)
42,949 participants, 352,422 items
| Maximum | 328101 |
| Decile 9 | 11685 |
| Decile 8 | 8689 |
| Decile 7 | 7207 |
| Decile 6 | 6255 |
| Median | 5538 |
| Decile 4 | 4961 |
| Decile 3 | 4446 |
| Decile 2 | 3947 |
| Decile 1 | 3401 |
| Minimum | 999 |
|
|
- There are 6421 distinct values.
- Mean = 7006.08
- Std.dev = 5663.58
- 8976 items above graph maximum of 19969
|
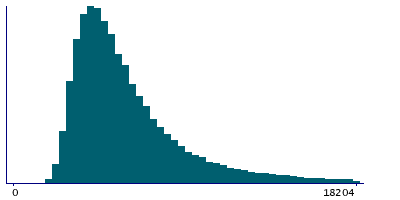
Instance 3 : First repeat imaging visit (2019+)
4,995 participants, 41,758 items
| Maximum | 212505 |
| Decile 9 | 10748 |
| Decile 8 | 8127 |
| Decile 7 | 6833 |
| Decile 6 | 5959 |
| Median | 5305 |
| Decile 4 | 4759 |
| Decile 3 | 4290 |
| Decile 2 | 3822 |
| Decile 1 | 3292 |
| Minimum | 920 |
|
|
- There are 2914 distinct values.
- Mean = 6542.65
- Std.dev = 4804.96
- 1006 items above graph maximum of 18204
|
Notes
This is the time the participant had been using the touchscreen before beginning the numeric memory test.
0 Related Data-Fields
There are no related data-fields


