Data
813,164 items of data are available, covering 90,873 participants.
Defined-instances run from 0 to 3, labelled using Instancing
2.
Array indices run from 0 to 15.
| Maximum | 15 |
| Decile 9 | 7 |
| Decile 8 | 6 |
| Decile 7 | 5 |
| Decile 6 | 4 |
| Median | 4 |
| Decile 4 | 3 |
| Decile 3 | 2 |
| Decile 2 | 1 |
| Decile 1 | 0 |
| Minimum | 0 |
|
|
- There are 16 distinct values.
- Mean = 3.75099
- Std.dev = 2.6111
- 3 items above graph maximum of 14
|
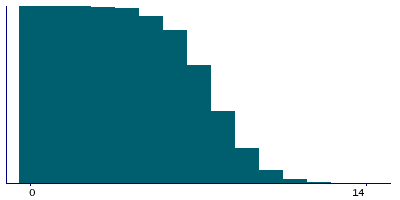
3 Instances
Instance 0 : Initial assessment visit (2006-2010) at which participants were recruited and consent given
51,614 participants, 418,943 items
| Maximum | 15 |
| Decile 9 | 7 |
| Decile 8 | 6 |
| Decile 7 | 5 |
| Decile 6 | 4 |
| Median | 4 |
| Decile 4 | 3 |
| Decile 3 | 2 |
| Decile 2 | 1 |
| Decile 1 | 0 |
| Minimum | 0 |
|

|
- There are 16 distinct values.
- Mean = 3.73519
- Std.dev = 2.60814
- 2 items above graph maximum of 14
|
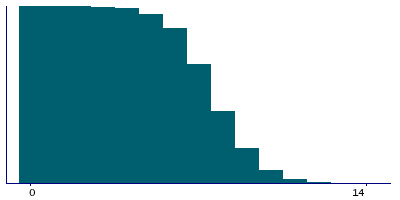
Instance 2 : Imaging visit (2014+)
42,959 participants, 352,459 items
| Maximum | 15 |
| Decile 9 | 7 |
| Decile 8 | 6 |
| Decile 7 | 5 |
| Decile 6 | 4 |
| Median | 4 |
| Decile 4 | 3 |
| Decile 3 | 2 |
| Decile 2 | 1 |
| Decile 1 | 0 |
| Minimum | 0 |
|
|
- There are 16 distinct values.
- Mean = 3.76078
- Std.dev = 2.61108
- 1 item above graph maximum of 14
|
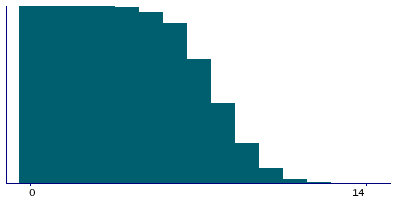
Instance 3 : First repeat imaging visit (2019+)
4,995 participants, 41,762 items
| Maximum | 14 |
| Decile 9 | 7 |
| Decile 8 | 6 |
| Decile 7 | 5 |
| Decile 6 | 5 |
| Median | 4 |
| Decile 4 | 3 |
| Decile 3 | 2 |
| Decile 2 | 1 |
| Decile 1 | 0 |
| Minimum | 0 |
|
|
- There are 15 distinct values.
- Mean = 3.82683
- Std.dev = 2.63903
|


