Data
99,999 items of data are available, covering 91,199 participants.
Some values have special meanings defined by Data-Coding
100696.
Defined-instances run from 0 to 3, labelled using Instancing
2.
Units of measurement are rounds.
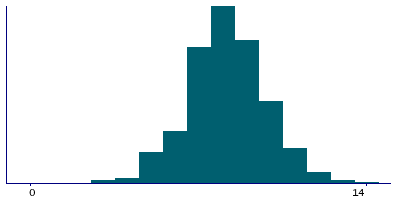
| Maximum | 16 |
| Decile 9 | 10 |
| Decile 8 | 9 |
| Decile 7 | 9 |
| Decile 6 | 9 |
| Median | 8 |
| Decile 4 | 8 |
| Decile 3 | 7 |
| Decile 2 | 7 |
| Decile 1 | 6 |
| Minimum | 1 |
|
|
- There are 16 distinct values.
- Mean = 8.16692
- Std.dev = 1.65419
- 23 items above graph maximum of 14
- 431 items have value -1 (Abandoned)
|
3 Instances
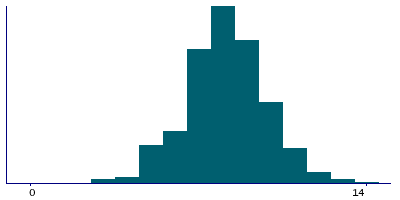
Instance 0 : Initial assessment visit (2006-2010) at which participants were recruited and consent given
51,757 participants, 51,757 items
| Maximum | 16 |
| Decile 9 | 10 |
| Decile 8 | 9 |
| Decile 7 | 9 |
| Decile 6 | 9 |
| Median | 8 |
| Decile 4 | 8 |
| Decile 3 | 7 |
| Decile 2 | 7 |
| Decile 1 | 6 |
| Minimum | 1 |
|
|
- There are 16 distinct values.
- Mean = 8.11685
- Std.dev = 1.69397
- 11 items above graph maximum of 14
- 143 items have value -1 (Abandoned)
|
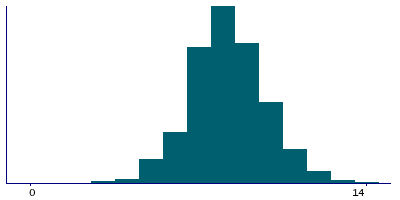
Instance 2 : Imaging visit (2014+)
43,149 participants, 43,149 items
| Maximum | 16 |
| Decile 9 | 10 |
| Decile 8 | 9 |
| Decile 7 | 9 |
| Decile 6 | 9 |
| Median | 8 |
| Decile 4 | 8 |
| Decile 3 | 7 |
| Decile 2 | 7 |
| Decile 1 | 6 |
| Minimum | 1 |
|
|
- There are 16 distinct values.
- Mean = 8.20454
- Std.dev = 1.61274
- 10 items above graph maximum of 14
- 190 items have value -1 (Abandoned)
|
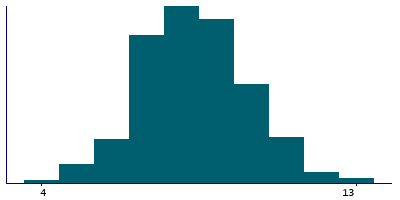
Instance 3 : First repeat imaging visit (2019+)
5,093 participants, 5,093 items
| Maximum | 15 |
| Decile 9 | 10 |
| Decile 8 | 10 |
| Decile 7 | 9 |
| Decile 6 | 9 |
| Median | 8 |
| Decile 4 | 8 |
| Decile 3 | 7 |
| Decile 2 | 7 |
| Decile 1 | 7 |
| Minimum | 3 |
|
|
- There are 13 distinct values.
- Mean = 8.36076
- Std.dev = 1.56487
- 6 items below graph minimum of 4
- 4 items above graph maximum of 13
- 98 items have value -1 (Abandoned)
|


