Data
9,226 items of data are available, covering 4,613 participants.
Defined-instances run from 2 to 3, labelled using Instancing
2.
Units of measurement are AU.
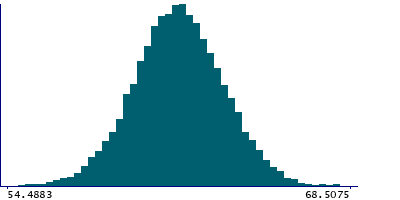
| Maximum | 70.5098 |
| Decile 9 | 63.8345 |
| Decile 8 | 63.0142 |
| Decile 7 | 62.4146 |
| Decile 6 | 61.9211 |
| Median | 61.4632 |
| Decile 4 | 61.0099 |
| Decile 3 | 60.5249 |
| Decile 2 | 59.9478 |
| Decile 1 | 59.1614 |
| Minimum | 38.071 |
|
|
- Mean = 61.466
- Std.dev = 1.88705
- 8 items below graph minimum of 54.4883
- 4 items above graph maximum of 68.5075
|
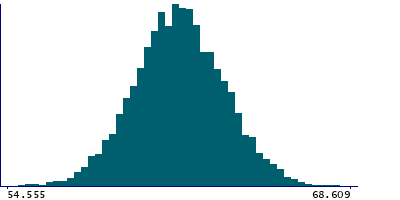
2 Instances
Instance 2 : Imaging visit (2014+)
4,613 participants, 4,613 items
| Maximum | 69.1411 |
| Decile 9 | 63.9244 |
| Decile 8 | 63.1345 |
| Decile 7 | 62.5189 |
| Decile 6 | 62.0119 |
| Median | 61.5747 |
| Decile 4 | 61.1025 |
| Decile 3 | 60.6311 |
| Decile 2 | 60.0599 |
| Decile 1 | 59.2397 |
| Minimum | 39.6145 |
|
|
- Mean = 61.5748
- Std.dev = 1.8797
- 4 items below graph minimum of 54.555
- 1 item above graph maximum of 68.609
|
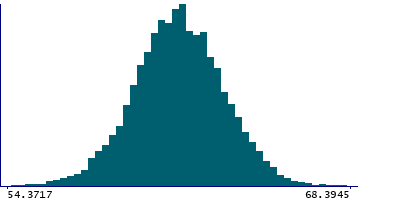
Instance 3 : First repeat imaging visit (2019+)
4,613 participants, 4,613 items
| Maximum | 70.5098 |
| Decile 9 | 63.7203 |
| Decile 8 | 62.8835 |
| Decile 7 | 62.3279 |
| Decile 6 | 61.8163 |
| Median | 61.3683 |
| Decile 4 | 60.9078 |
| Decile 3 | 60.4359 |
| Decile 2 | 59.8684 |
| Decile 1 | 59.046 |
| Minimum | 38.071 |
|
|
- Mean = 61.3572
- Std.dev = 1.88812
- 4 items below graph minimum of 54.3717
- 3 items above graph maximum of 68.3945
|
Notes
Mean intensity of the cerebellum cortex in the left hemisphere generated by subcortical volumetric segmentation (aseg) with the longitudinal processing option in FreeSurfer.
1 Related Data-Field
| Field ID | Description | Relationship |
|---|
| 42969 | Mean intensity of Cerebellum-Cortex ... | Current Field is the left-side counterpart of right-side Field 42969 |
0 Resources
There are no matching Resources
