Data
9,226 items of data are available, covering 4,613 participants.
Defined-instances run from 2 to 3, labelled using Instancing
2.
Units of measurement are AU.
| Maximum | 109.865 |
| Decile 9 | 89.7157 |
| Decile 8 | 86.9727 |
| Decile 7 | 85.3577 |
| Decile 6 | 84.0958 |
| Median | 83.0823 |
| Decile 4 | 82.1812 |
| Decile 3 | 81.3824 |
| Decile 2 | 80.5512 |
| Decile 1 | 79.4089 |
| Minimum | 62.1745 |
|
|
- Mean = 83.945
- Std.dev = 4.31353
- 1 item below graph minimum of 69.102
- 48 items above graph maximum of 100.023
|
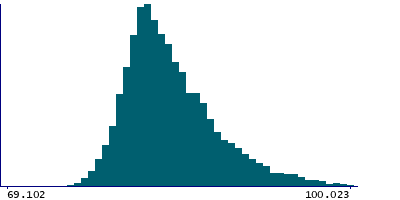
2 Instances
Instance 2 : Imaging visit (2014+)
4,613 participants, 4,613 items
| Maximum | 104.33 |
| Decile 9 | 89.403 |
| Decile 8 | 86.7568 |
| Decile 7 | 85.2029 |
| Decile 6 | 83.9706 |
| Median | 83.0474 |
| Decile 4 | 82.1565 |
| Decile 3 | 81.3833 |
| Decile 2 | 80.5688 |
| Decile 1 | 79.4469 |
| Minimum | 62.1745 |
|

|
- Mean = 83.8513
- Std.dev = 4.20358
- 1 item below graph minimum of 69.4908
- 28 items above graph maximum of 99.3591
|
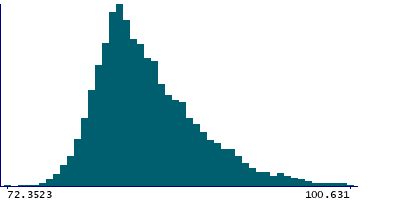
Instance 3 : First repeat imaging visit (2019+)
4,613 participants, 4,613 items
| Maximum | 109.865 |
| Decile 9 | 89.9993 |
| Decile 8 | 87.2647 |
| Decile 7 | 85.5866 |
| Decile 6 | 84.2343 |
| Median | 83.1485 |
| Decile 4 | 82.2038 |
| Decile 3 | 81.3771 |
| Decile 2 | 80.5429 |
| Decile 1 | 79.3674 |
| Minimum | 72.3523 |
|
|
- Mean = 84.0388
- Std.dev = 4.41875
- 19 items above graph maximum of 100.631
|
Notes
Mean intensity of the thalamus-proper in the left hemisphere generated by subcortical volumetric segmentation (aseg) with the longitudinal processing option in FreeSurfer.
1 Related Data-Field
| Field ID | Description | Relationship |
|---|
| 42970 | Mean intensity of Thalamus-Proper (r ... | Current Field is the left-side counterpart of right-side Field 42970 |
0 Resources
There are no matching Resources
