Data
9,226 items of data are available, covering 4,613 participants.
Defined-instances run from 2 to 3, labelled using Instancing
2.
Units of measurement are AU.
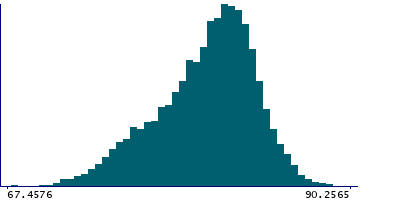
| Maximum | 90.2565 |
| Decile 9 | 84.3347 |
| Decile 8 | 83.3387 |
| Decile 7 | 82.6088 |
| Decile 6 | 81.8931 |
| Median | 81.1367 |
| Decile 4 | 80.3006 |
| Decile 3 | 79.2767 |
| Decile 2 | 77.8685 |
| Decile 1 | 75.8962 |
| Minimum | 53.3615 |
|
|
- Mean = 80.6265
- Std.dev = 3.25942
- 3 items below graph minimum of 67.4576
|
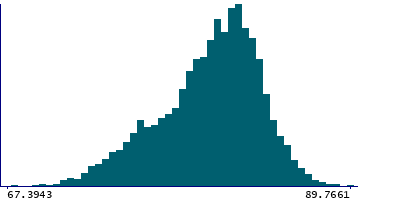
2 Instances
Instance 2 : Imaging visit (2014+)
4,613 participants, 4,613 items
| Maximum | 89.7661 |
| Decile 9 | 84.2459 |
| Decile 8 | 83.2898 |
| Decile 7 | 82.5199 |
| Decile 6 | 81.8363 |
| Median | 81.0546 |
| Decile 4 | 80.203 |
| Decile 3 | 79.2065 |
| Decile 2 | 77.7687 |
| Decile 1 | 75.8201 |
| Minimum | 67.015 |
|
|
- Mean = 80.5425
- Std.dev = 3.26858
- 1 item below graph minimum of 67.3943
|
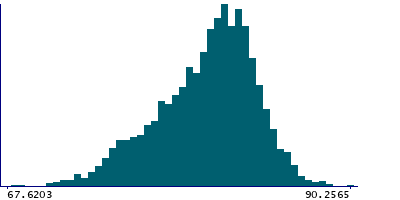
Instance 3 : First repeat imaging visit (2019+)
4,613 participants, 4,613 items
| Maximum | 90.2565 |
| Decile 9 | 84.4092 |
| Decile 8 | 83.3858 |
| Decile 7 | 82.6952 |
| Decile 6 | 81.933 |
| Median | 81.2355 |
| Decile 4 | 80.3995 |
| Decile 3 | 79.3336 |
| Decile 2 | 77.9566 |
| Decile 1 | 76.0147 |
| Minimum | 53.3615 |
|
|
- Mean = 80.7105
- Std.dev = 3.24806
- 2 items below graph minimum of 67.6203
|
Notes
Mean intensity of the putamen in the left hemisphere generated by subcortical volumetric segmentation (aseg) with the longitudinal processing option in FreeSurfer.
1 Related Data-Field
| Field ID | Description | Relationship |
|---|
| 42972 | Mean intensity of Putamen (right hem ... | Current Field is the left-side counterpart of right-side Field 42972 |
0 Resources
There are no matching Resources
