Data
9,226 items of data are available, covering 4,613 participants.
Defined-instances run from 2 to 3, labelled using Instancing
2.
Units of measurement are AU.
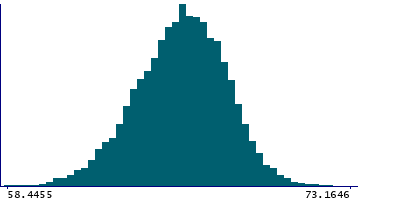
| Maximum | 84.7467 |
| Decile 9 | 68.2583 |
| Decile 8 | 67.5328 |
| Decile 7 | 66.9692 |
| Decile 6 | 66.4686 |
| Median | 65.981 |
| Decile 4 | 65.4884 |
| Decile 3 | 64.9428 |
| Decile 2 | 64.2619 |
| Decile 1 | 63.3519 |
| Minimum | 46.326 |
|
|
- Mean = 65.8865
- Std.dev = 1.96134
- 2 items below graph minimum of 58.4455
- 3 items above graph maximum of 73.1646
|
2 Instances
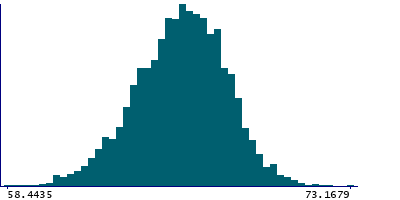
Instance 2 : Imaging visit (2014+)
4,613 participants, 4,613 items
| Maximum | 84.7467 |
| Decile 9 | 68.2598 |
| Decile 8 | 67.5249 |
| Decile 7 | 66.974 |
| Decile 6 | 66.4698 |
| Median | 65.9848 |
| Decile 4 | 65.4845 |
| Decile 3 | 64.9389 |
| Decile 2 | 64.2502 |
| Decile 1 | 63.3516 |
| Minimum | 46.326 |
|
|
- Mean = 65.8834
- Std.dev = 1.98558
- 1 item below graph minimum of 58.4435
- 1 item above graph maximum of 73.1679
|
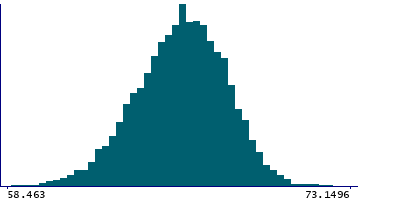
Instance 3 : First repeat imaging visit (2019+)
4,613 participants, 4,613 items
| Maximum | 74.0284 |
| Decile 9 | 68.2541 |
| Decile 8 | 67.5433 |
| Decile 7 | 66.9645 |
| Decile 6 | 66.4643 |
| Median | 65.9772 |
| Decile 4 | 65.4952 |
| Decile 3 | 64.9489 |
| Decile 2 | 64.2737 |
| Decile 1 | 63.3586 |
| Minimum | 57.9758 |
|
|
- Mean = 65.8896
- Std.dev = 1.93679
- 1 item below graph minimum of 58.463
- 2 items above graph maximum of 73.1496
|
Notes
Mean intensity of the hippocampus in the left hemisphere generated by subcortical volumetric segmentation (aseg) with the longitudinal processing option in FreeSurfer.
1 Related Data-Field
| Field ID | Description | Relationship |
|---|
| 42974 | Mean intensity of Hippocampus (right ... | Current Field is the left-side counterpart of right-side Field 42974 |
0 Resources
There are no matching Resources
