Data
9,226 items of data are available, covering 4,613 participants.
Defined-instances run from 2 to 3, labelled using Instancing
2.
Units of measurement are AU.
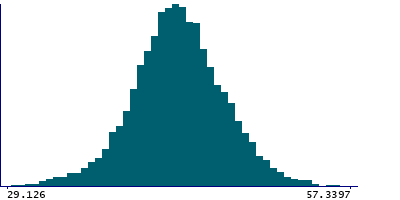
| Maximum | 62.8269 |
| Decile 9 | 47.9352 |
| Decile 8 | 46.2108 |
| Decile 7 | 44.9705 |
| Decile 6 | 43.9991 |
| Median | 43.1206 |
| Decile 4 | 42.248 |
| Decile 3 | 41.3409 |
| Decile 2 | 40.209 |
| Decile 1 | 38.5306 |
| Minimum | 24.4405 |
|
|
- Mean = 43.1489
- Std.dev = 3.7964
- 8 items below graph minimum of 29.126
- 3 items above graph maximum of 57.3397
|
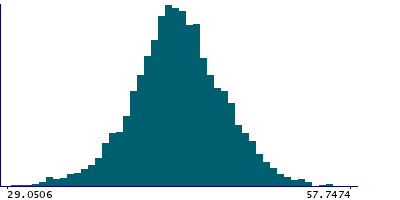
2 Instances
Instance 2 : Imaging visit (2014+)
4,613 participants, 4,613 items
| Maximum | 62.8269 |
| Decile 9 | 48.1818 |
| Decile 8 | 46.4825 |
| Decile 7 | 45.1525 |
| Decile 6 | 44.1872 |
| Median | 43.3017 |
| Decile 4 | 42.4317 |
| Decile 3 | 41.5096 |
| Decile 2 | 40.3693 |
| Decile 1 | 38.6162 |
| Minimum | 26.0615 |
|
|
- Mean = 43.3364
- Std.dev = 3.82903
- 4 items below graph minimum of 29.0506
- 2 items above graph maximum of 57.7474
|
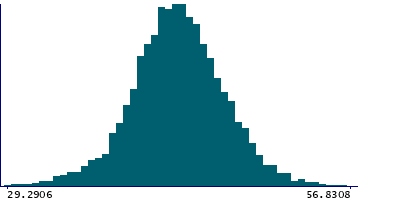
Instance 3 : First repeat imaging visit (2019+)
4,613 participants, 4,613 items
| Maximum | 57.6172 |
| Decile 9 | 47.6508 |
| Decile 8 | 45.9682 |
| Decile 7 | 44.7745 |
| Decile 6 | 43.8212 |
| Median | 42.9428 |
| Decile 4 | 42.0592 |
| Decile 3 | 41.185 |
| Decile 2 | 40.0688 |
| Decile 1 | 38.4707 |
| Minimum | 24.4405 |
|
|
- Mean = 42.9614
- Std.dev = 3.75413
- 4 items below graph minimum of 29.2906
- 2 items above graph maximum of 56.8308
|
Notes
Mean intensity of the CSF in the whole brain generated by subcortical volumetric segmentation (aseg) with the longitudinal processing option in FreeSurfer.
0 Related Data-Fields
There are no related data-fields
0 Resources
There are no matching Resources
