Data
9,226 items of data are available, covering 4,613 participants.
Defined-instances run from 2 to 3, labelled using Instancing
2.
Units of measurement are AU.
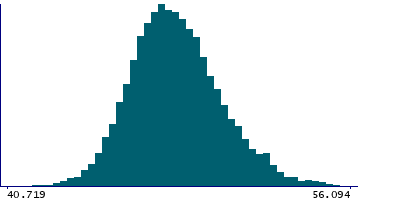
| Maximum | 61.9957 |
| Decile 9 | 50.969 |
| Decile 8 | 49.9034 |
| Decile 7 | 49.2133 |
| Decile 6 | 48.6469 |
| Median | 48.1391 |
| Decile 4 | 47.6458 |
| Decile 3 | 47.1519 |
| Decile 2 | 46.6095 |
| Decile 1 | 45.844 |
| Minimum | 40.5638 |
|
|
- Mean = 48.2875
- Std.dev = 2.04021
- 1 item below graph minimum of 40.719
- 9 items above graph maximum of 56.094
|
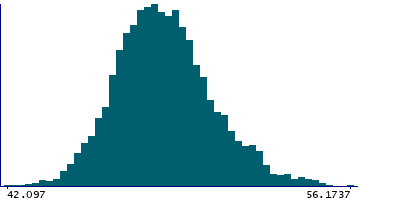
2 Instances
Instance 2 : Imaging visit (2014+)
4,613 participants, 4,613 items
| Maximum | 61.9957 |
| Decile 9 | 51.1623 |
| Decile 8 | 50.0977 |
| Decile 7 | 49.4315 |
| Decile 6 | 48.9239 |
| Median | 48.4173 |
| Decile 4 | 47.9183 |
| Decile 3 | 47.4351 |
| Decile 2 | 46.8799 |
| Decile 1 | 46.1508 |
| Minimum | 42.097 |
|
|
- Mean = 48.5442
- Std.dev = 2.0107
- 5 items above graph maximum of 56.1737
|
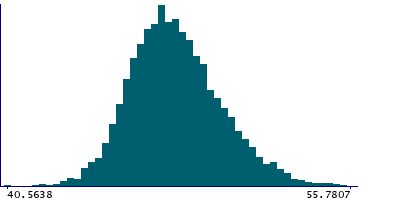
Instance 3 : First repeat imaging visit (2019+)
4,613 participants, 4,613 items
| Maximum | 59.1018 |
| Decile 9 | 50.7011 |
| Decile 8 | 49.6786 |
| Decile 7 | 48.955 |
| Decile 6 | 48.3773 |
| Median | 47.8684 |
| Decile 4 | 47.388 |
| Decile 3 | 46.8935 |
| Decile 2 | 46.343 |
| Decile 1 | 45.6215 |
| Minimum | 40.5638 |
|
|
- Mean = 48.0308
- Std.dev = 2.03722
- 4 items above graph maximum of 55.7807
|
Notes
Mean intensity of the choroid plexus in the left hemisphere generated by subcortical volumetric segmentation (aseg) with the longitudinal processing option in FreeSurfer.
1 Related Data-Field
| Field ID | Description | Relationship |
|---|
| 42979 | Mean intensity of choroid-plexus (ri ... | Current Field is the left-side counterpart of right-side Field 42979 |
0 Resources
There are no matching Resources
