Data
9,226 items of data are available, covering 4,613 participants.
Defined-instances run from 2 to 3, labelled using Instancing
2.
Units of measurement are AU.
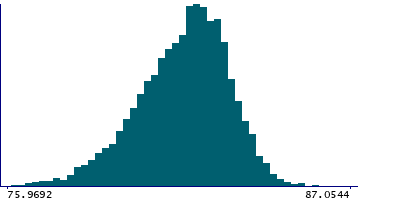
| Maximum | 93.4655 |
| Decile 9 | 83.3594 |
| Decile 8 | 82.8614 |
| Decile 7 | 82.4948 |
| Decile 6 | 82.1502 |
| Median | 81.8123 |
| Decile 4 | 81.4126 |
| Decile 3 | 80.9642 |
| Decile 2 | 80.4325 |
| Decile 1 | 79.6643 |
| Minimum | 68.9364 |
|
|
- Mean = 81.6267
- Std.dev = 1.49141
- 9 items below graph minimum of 75.9692
- 1 item above graph maximum of 87.0544
|
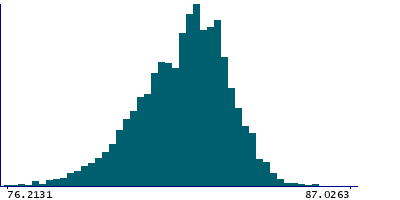
2 Instances
Instance 2 : Imaging visit (2014+)
4,613 participants, 4,613 items
| Maximum | 93.4655 |
| Decile 9 | 83.4219 |
| Decile 8 | 82.9329 |
| Decile 7 | 82.5916 |
| Decile 6 | 82.2291 |
| Median | 81.915 |
| Decile 4 | 81.5385 |
| Decile 3 | 81.0789 |
| Decile 2 | 80.5508 |
| Decile 1 | 79.8175 |
| Minimum | 70.0343 |
|
|
- Mean = 81.7351
- Std.dev = 1.46011
- 4 items below graph minimum of 76.2131
- 1 item above graph maximum of 87.0263
|
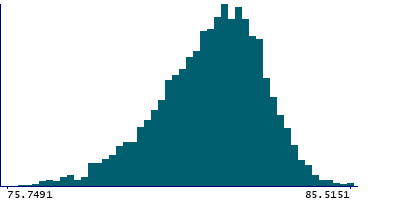
Instance 3 : First repeat imaging visit (2019+)
4,613 participants, 4,613 items
| Maximum | 85.5151 |
| Decile 9 | 83.2736 |
| Decile 8 | 82.7919 |
| Decile 7 | 82.4036 |
| Decile 6 | 82.0494 |
| Median | 81.7011 |
| Decile 4 | 81.3084 |
| Decile 3 | 80.8476 |
| Decile 2 | 80.3089 |
| Decile 1 | 79.5113 |
| Minimum | 68.9364 |
|
|
- Mean = 81.5183
- Std.dev = 1.51433
- 5 items below graph minimum of 75.7491
|
Notes
Mean intensity of the cerebellum white matter in the right hemisphere generated by subcortical volumetric segmentation (aseg) with the longitudinal processing option in FreeSurfer.
1 Related Data-Field
| Field ID | Description | Relationship |
|---|
| 42950 | Mean intensity of Cerebellum-White-M ... | Field 42950 is the left-side counterpart of right-side Current Field |
0 Resources
There are no matching Resources
