Data
9,226 items of data are available, covering 4,613 participants.
Defined-instances run from 2 to 3, labelled using Instancing
2.
Units of measurement are AU.
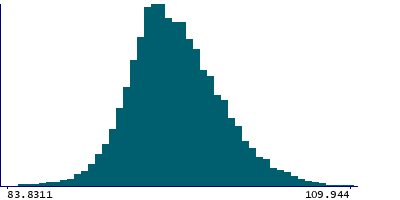
| Maximum | 113.015 |
| Decile 9 | 101.24 |
| Decile 8 | 99.436 |
| Decile 7 | 98.2022 |
| Decile 6 | 97.2251 |
| Median | 96.342 |
| Decile 4 | 95.5075 |
| Decile 3 | 94.7001 |
| Decile 2 | 93.8278 |
| Decile 1 | 92.5356 |
| Minimum | 61.2792 |
|
|
- Mean = 96.6302
- Std.dev = 3.5593
- 3 items below graph minimum of 83.8311
- 13 items above graph maximum of 109.944
|
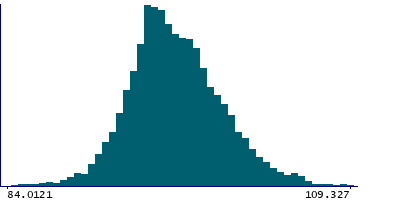
2 Instances
Instance 2 : Imaging visit (2014+)
4,613 participants, 4,613 items
| Maximum | 112.683 |
| Decile 9 | 100.888 |
| Decile 8 | 99.2274 |
| Decile 7 | 98.0198 |
| Decile 6 | 97.0554 |
| Median | 96.1377 |
| Decile 4 | 95.3243 |
| Decile 3 | 94.554 |
| Decile 2 | 93.7229 |
| Decile 1 | 92.4503 |
| Minimum | 63.6474 |
|
|
- Mean = 96.4417
- Std.dev = 3.50394
- 2 items below graph minimum of 84.0121
- 10 items above graph maximum of 109.327
|
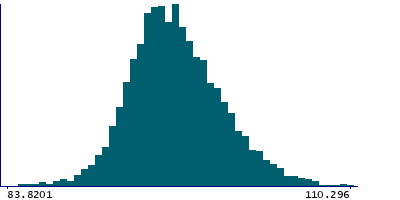
Instance 3 : First repeat imaging visit (2019+)
4,613 participants, 4,613 items
| Maximum | 113.015 |
| Decile 9 | 101.471 |
| Decile 8 | 99.726 |
| Decile 7 | 98.4561 |
| Decile 6 | 97.3827 |
| Median | 96.5698 |
| Decile 4 | 95.6972 |
| Decile 3 | 94.8355 |
| Decile 2 | 93.9437 |
| Decile 1 | 92.6453 |
| Minimum | 61.2792 |
|
|
- Mean = 96.8188
- Std.dev = 3.60396
- 1 item below graph minimum of 83.8201
- 1 item above graph maximum of 110.296
|
Notes
Mean intensity of the pallidum in the right hemisphere generated by subcortical volumetric segmentation (aseg) with the longitudinal processing option in FreeSurfer.
1 Related Data-Field
| Field ID | Description | Relationship |
|---|
| 42955 | Mean intensity of Pallidum (left hem ... | Field 42955 is the left-side counterpart of right-side Current Field |
0 Resources
There are no matching Resources
