Data
9,226 items of data are available, covering 4,613 participants.
Defined-instances run from 2 to 3, labelled using Instancing
2.
Units of measurement are AU.
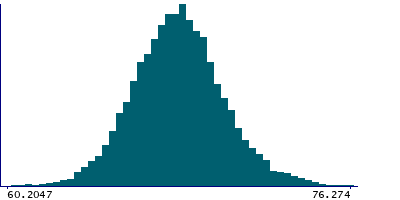
| Maximum | 87.6423 |
| Decile 9 | 70.9176 |
| Decile 8 | 69.8945 |
| Decile 7 | 69.2458 |
| Decile 6 | 68.6805 |
| Median | 68.1862 |
| Decile 4 | 67.6652 |
| Decile 3 | 67.1183 |
| Decile 2 | 66.4654 |
| Decile 1 | 65.5611 |
| Minimum | 47.5376 |
|
|
- Mean = 68.2257
- Std.dev = 2.1891
- 3 items below graph minimum of 60.2047
- 16 items above graph maximum of 76.274
|
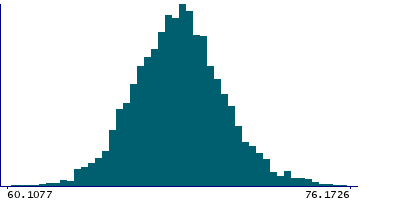
2 Instances
Instance 2 : Imaging visit (2014+)
4,613 participants, 4,613 items
| Maximum | 87.6423 |
| Decile 9 | 70.8177 |
| Decile 8 | 69.8453 |
| Decile 7 | 69.1883 |
| Decile 6 | 68.6132 |
| Median | 68.137 |
| Decile 4 | 67.6136 |
| Decile 3 | 67.0596 |
| Decile 2 | 66.3689 |
| Decile 1 | 65.4627 |
| Minimum | 50.6436 |
|
|
- Mean = 68.1525
- Std.dev = 2.18632
- 1 item below graph minimum of 60.1077
- 8 items above graph maximum of 76.1726
|
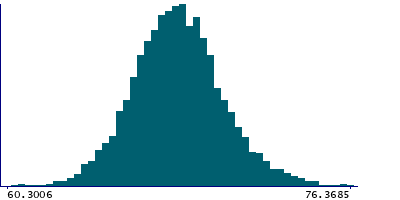
Instance 3 : First repeat imaging visit (2019+)
4,613 participants, 4,613 items
| Maximum | 78.2667 |
| Decile 9 | 71.0126 |
| Decile 8 | 69.9463 |
| Decile 7 | 69.3075 |
| Decile 6 | 68.7399 |
| Median | 68.2392 |
| Decile 4 | 67.718 |
| Decile 3 | 67.1799 |
| Decile 2 | 66.5425 |
| Decile 1 | 65.6566 |
| Minimum | 47.5376 |
|
|
- Mean = 68.2989
- Std.dev = 2.18943
- 2 items below graph minimum of 60.3006
- 8 items above graph maximum of 76.3685
|
Notes
Mean intensity of the amygdala in the right hemisphere generated by subcortical volumetric segmentation (aseg) with the longitudinal processing option in FreeSurfer.
1 Related Data-Field
| Field ID | Description | Relationship |
|---|
| 42960 | Mean intensity of Amygdala (left hem ... | Field 42960 is the left-side counterpart of right-side Current Field |
0 Resources
There are no matching Resources
