Data
9,226 items of data are available, covering 4,613 participants.
Defined-instances run from 2 to 3, labelled using Instancing
2.
Units of measurement are AU.
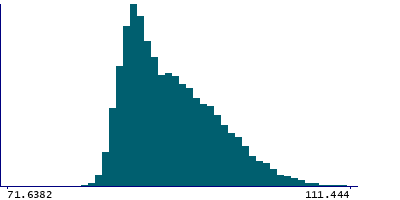
| Maximum | 113.378 |
| Decile 9 | 98.1753 |
| Decile 8 | 95.2994 |
| Decile 7 | 93.1427 |
| Decile 6 | 91.3439 |
| Median | 89.7133 |
| Decile 4 | 88.2218 |
| Decile 3 | 87.0413 |
| Decile 2 | 86.0499 |
| Decile 1 | 84.9067 |
| Minimum | 63.6992 |
|
|
- Mean = 90.7163
- Std.dev = 5.20679
- 1 item below graph minimum of 71.6382
- 3 items above graph maximum of 111.444
|
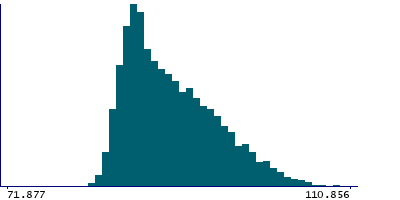
2 Instances
Instance 2 : Imaging visit (2014+)
4,613 participants, 4,613 items
| Maximum | 113.048 |
| Decile 9 | 97.8633 |
| Decile 8 | 95.0506 |
| Decile 7 | 92.9111 |
| Decile 6 | 91.1107 |
| Median | 89.4787 |
| Decile 4 | 88.0823 |
| Decile 3 | 86.9123 |
| Decile 2 | 85.9511 |
| Decile 1 | 84.8702 |
| Minimum | 63.6992 |
|
|
- Mean = 90.5423
- Std.dev = 5.12363
- 1 item below graph minimum of 71.877
- 2 items above graph maximum of 110.856
|
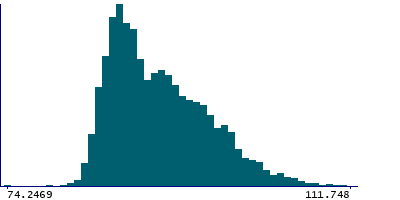
Instance 3 : First repeat imaging visit (2019+)
4,613 participants, 4,613 items
| Maximum | 113.378 |
| Decile 9 | 98.3488 |
| Decile 8 | 95.5438 |
| Decile 7 | 93.4338 |
| Decile 6 | 91.5384 |
| Median | 89.9384 |
| Decile 4 | 88.3287 |
| Decile 3 | 87.1603 |
| Decile 2 | 86.1467 |
| Decile 1 | 84.9502 |
| Minimum | 74.2469 |
|
|
- Mean = 90.8902
- Std.dev = 5.28291
- 1 item above graph maximum of 111.748
|
Notes
Mean intensity of the ventral DC in the right hemisphere generated by subcortical volumetric segmentation (aseg) with the longitudinal processing option in FreeSurfer.
1 Related Data-Field
| Field ID | Description | Relationship |
|---|
| 42963 | Mean intensity of VentralDC (left he ... | Field 42963 is the left-side counterpart of right-side Current Field |
0 Resources
There are no matching Resources
