Data
9,226 items of data are available, covering 4,613 participants.
Defined-instances run from 2 to 3, labelled using Instancing
2.
Units of measurement are AU.
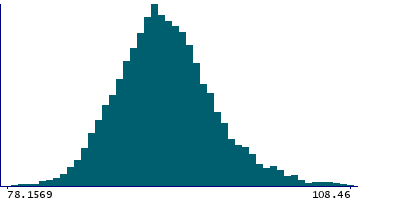
| Maximum | 114.598 |
| Decile 9 | 97.6534 |
| Decile 8 | 95.4933 |
| Decile 7 | 94.0812 |
| Decile 6 | 92.9494 |
| Median | 91.903 |
| Decile 4 | 90.9303 |
| Decile 3 | 89.8691 |
| Decile 2 | 88.6019 |
| Decile 1 | 86.8466 |
| Minimum | 78.1569 |
|
|
- Mean = 92.1674
- Std.dev = 4.34896
- 11 items above graph maximum of 108.46
|
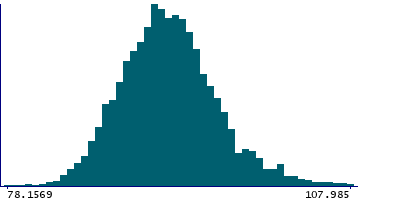
2 Instances
Instance 2 : Imaging visit (2014+)
4,613 participants, 4,613 items
| Maximum | 114.021 |
| Decile 9 | 97.4975 |
| Decile 8 | 95.4758 |
| Decile 7 | 94.1345 |
| Decile 6 | 93.0419 |
| Median | 91.9723 |
| Decile 4 | 91.0177 |
| Decile 3 | 89.9584 |
| Decile 2 | 88.6547 |
| Decile 1 | 87.0096 |
| Minimum | 78.1569 |
|
|
- Mean = 92.2421
- Std.dev = 4.2934
- 8 items above graph maximum of 107.985
|
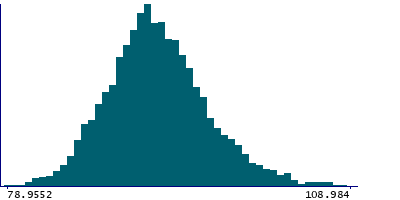
Instance 3 : First repeat imaging visit (2019+)
4,613 participants, 4,613 items
| Maximum | 114.598 |
| Decile 9 | 97.8377 |
| Decile 8 | 95.5094 |
| Decile 7 | 94.0616 |
| Decile 6 | 92.861 |
| Median | 91.8037 |
| Decile 4 | 90.8227 |
| Decile 3 | 89.7779 |
| Decile 2 | 88.531 |
| Decile 1 | 86.6913 |
| Minimum | 78.9552 |
|
|
- Mean = 92.0928
- Std.dev = 4.40255
- 4 items above graph maximum of 108.984
|
Notes
Mean intensity of the corpus callosum - mid-posterior in the whole brain generated by subcortical volumetric segmentation (aseg) with the longitudinal processing option in FreeSurfer.
0 Related Data-Fields
There are no related data-fields
0 Resources
There are no matching Resources
