Data
9,226 items of data are available, covering 4,613 participants.
Defined-instances run from 2 to 3, labelled using Instancing
2.
Units of measurement are AU.
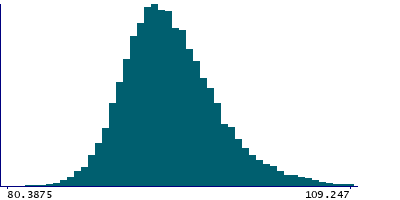
| Maximum | 114.288 |
| Decile 9 | 99.3924 |
| Decile 8 | 97.2364 |
| Decile 7 | 95.8337 |
| Decile 6 | 94.7493 |
| Median | 93.7646 |
| Decile 4 | 92.8452 |
| Decile 3 | 91.9398 |
| Decile 2 | 90.9072 |
| Decile 1 | 89.5374 |
| Minimum | 80.3875 |
|
|
- Mean = 94.1863
- Std.dev = 4.00139
- 20 items above graph maximum of 109.247
|
2 Instances
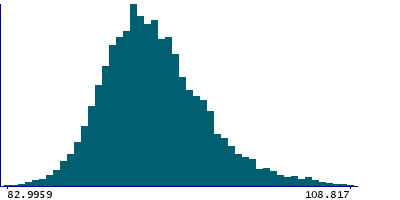
Instance 2 : Imaging visit (2014+)
4,613 participants, 4,613 items
| Maximum | 114.229 |
| Decile 9 | 99.1828 |
| Decile 8 | 97.1038 |
| Decile 7 | 95.64 |
| Decile 6 | 94.6379 |
| Median | 93.6848 |
| Decile 4 | 92.7696 |
| Decile 3 | 91.9275 |
| Decile 2 | 90.8553 |
| Decile 1 | 89.5483 |
| Minimum | 82.9959 |
|
|
- Mean = 94.1038
- Std.dev = 3.94042
- 11 items above graph maximum of 108.817
|
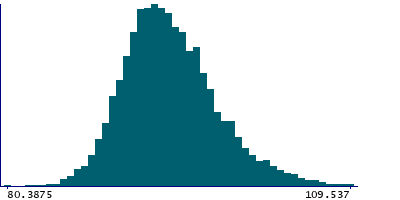
Instance 3 : First repeat imaging visit (2019+)
4,613 participants, 4,613 items
| Maximum | 114.288 |
| Decile 9 | 99.5349 |
| Decile 8 | 97.3548 |
| Decile 7 | 96.025 |
| Decile 6 | 94.8547 |
| Median | 93.8599 |
| Decile 4 | 92.9142 |
| Decile 3 | 91.9524 |
| Decile 2 | 90.9588 |
| Decile 1 | 89.533 |
| Minimum | 80.3875 |
|
|
- Mean = 94.2688
- Std.dev = 4.05977
- 9 items above graph maximum of 109.537
|
Notes
Mean intensity of the corpus callosum - central in the whole brain generated by subcortical volumetric segmentation (aseg) with the longitudinal processing option in FreeSurfer.
0 Related Data-Fields
There are no related data-fields
0 Resources
There are no matching Resources
