Data
298,052 items of data are available, covering 236,009 participants.
Defined-instances run from 0 to 3, labelled using Instancing
2.
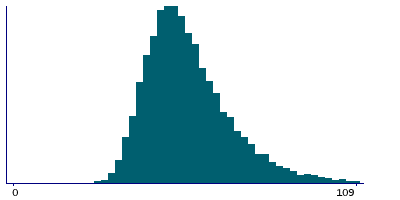
| Maximum | 10709 |
| Decile 9 | 79 |
| Decile 8 | 68 |
| Decile 7 | 62 |
| Decile 6 | 58 |
| Median | 54 |
| Decile 4 | 51 |
| Decile 3 | 48 |
| Decile 2 | 44 |
| Decile 1 | 40 |
| Minimum | 5 |
|
|
- There are 421 distinct values.
- Mean = 58.1398
- Std.dev = 34.5815
- 4037 items above graph maximum of 118
|
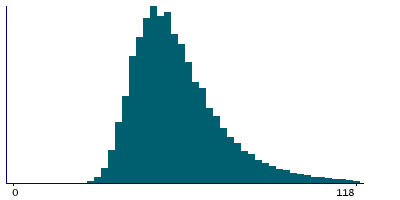
4 Instances
Instance 0 : Initial assessment visit (2006-2010) at which participants were recruited and consent given
164,895 participants, 164,895 items
| Maximum | 2933 |
| Decile 9 | 80 |
| Decile 8 | 69 |
| Decile 7 | 62 |
| Decile 6 | 58 |
| Median | 54 |
| Decile 4 | 51 |
| Decile 3 | 47 |
| Decile 2 | 44 |
| Decile 1 | 40 |
| Minimum | 5 |
|
|
- There are 380 distinct values.
- Mean = 58.5449
- Std.dev = 25.4069
- 2575 items above graph maximum of 120
|
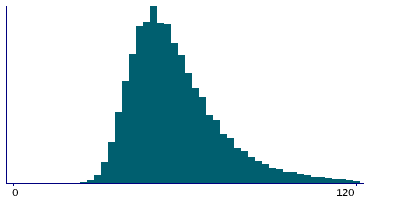
Instance 1 : First repeat assessment visit (2012-13)
20,059 participants, 20,059 items
| Maximum | 823 |
| Decile 9 | 77 |
| Decile 8 | 67 |
| Decile 7 | 61 |
| Decile 6 | 57 |
| Median | 53 |
| Decile 4 | 50 |
| Decile 3 | 47 |
| Decile 2 | 44 |
| Decile 1 | 40 |
| Minimum | 24 |
|
|
- There are 179 distinct values.
- Mean = 56.8047
- Std.dev = 20.1268
- 240 items above graph maximum of 114
|
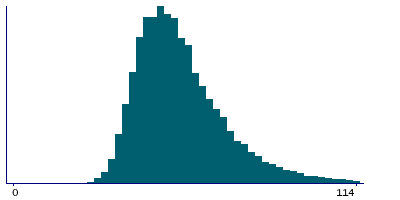
Instance 2 : Imaging visit (2014+)
93,390 participants, 93,390 items
| Maximum | 10709 |
| Decile 9 | 77 |
| Decile 8 | 67 |
| Decile 7 | 62 |
| Decile 6 | 58 |
| Median | 54 |
| Decile 4 | 51 |
| Decile 3 | 48 |
| Decile 2 | 45 |
| Decile 1 | 41 |
| Minimum | 16 |
|
|
- There are 261 distinct values.
- Mean = 57.8626
- Std.dev = 46.1881
- 1118 items above graph maximum of 113
|
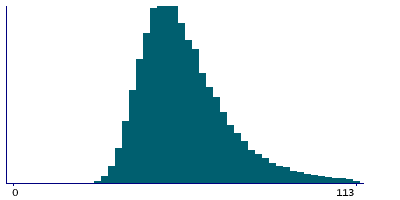
Instance 3 : First repeat imaging visit (2019+)
19,708 participants, 19,708 items
| Maximum | 6115 |
| Decile 9 | 76 |
| Decile 8 | 67 |
| Decile 7 | 61 |
| Decile 6 | 57 |
| Median | 54 |
| Decile 4 | 51 |
| Decile 3 | 48 |
| Decile 2 | 45 |
| Decile 1 | 41 |
| Minimum | 26 |
|
|
- There are 165 distinct values.
- Mean = 57.4225
- Std.dev = 46.4678
- 210 items above graph maximum of 111
|

