Data
1,325,570 items of data are available, covering 88,125 participants.
Defined-instances run from 2 to 3, labelled using Instancing
2.
Array indices run from 0 to 14.
Units of measurement are deciseconds.
| Maximum | 1173 |
| Decile 9 | 212 |
| Decile 8 | 157 |
| Decile 7 | 125 |
| Decile 6 | 102 |
| Median | 83 |
| Decile 4 | 67 |
| Decile 3 | 52 |
| Decile 2 | 40 |
| Decile 1 | 30 |
| Minimum | 0 |
|

|
- There are 868 distinct values.
- Mean = 105.998
- Std.dev = 82.7181
- 14618 items above graph maximum of 394
|
2 Instances
Instance 2 : Imaging visit (2014+)
81,614 participants, 1,065,439 items
| Maximum | 1173 |
| Decile 9 | 213 |
| Decile 8 | 157 |
| Decile 7 | 124 |
| Decile 6 | 101 |
| Median | 83 |
| Decile 4 | 67 |
| Decile 3 | 52 |
| Decile 2 | 40 |
| Decile 1 | 30 |
| Minimum | 0 |
|
|
- There are 854 distinct values.
- Mean = 106.038
- Std.dev = 83.0877
- 11860 items above graph maximum of 396
|
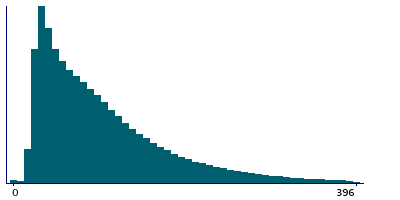
Instance 3 : First repeat imaging visit (2019+)
19,836 participants, 260,131 items
| Maximum | 1065 |
| Decile 9 | 211 |
| Decile 8 | 157 |
| Decile 7 | 125 |
| Decile 6 | 102 |
| Median | 84 |
| Decile 4 | 68 |
| Decile 3 | 53 |
| Decile 2 | 40 |
| Decile 1 | 30 |
| Minimum | 0 |
|

|
- There are 724 distinct values.
- Mean = 105.834
- Std.dev = 81.1867
- 2695 items above graph maximum of 392
|
Notes
This is an array of values, one for each puzzle answered, detailing how long the participant spent looking at a puzzle before selecting their answer.
Some values are zero indicating a response time of less than 0.1 seconds, which is below the realistic minimum time for mentally processing the picture and deciding which image to touch. Such values are assumed to be due to a participant hovering a finger over the screen and accidentally making contact with it when the puzzle first appears.
2 Related Data-Fields
| Field ID | Description | Relationship |
|---|
| 20763 | Duration spent answering each puzzle | Field 20763 is the online equivalent of Current Field |
| 6332 | Item selected for each puzzle | Current Field is the interval the participant required to select Field 6332 |


