Data
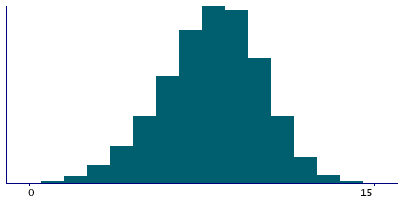
101,458 items of data are available, covering 88,132 participants.
Defined-instances run from 2 to 3, labelled using Instancing
2.
Units of measurement are correct-answers.
| Maximum | 15 |
| Decile 9 | 11 |
| Decile 8 | 10 |
| Decile 7 | 9 |
| Decile 6 | 9 |
| Median | 8 |
| Decile 4 | 7 |
| Decile 3 | 7 |
| Decile 2 | 6 |
| Decile 1 | 5 |
| Minimum | 0 |
|
|
- There are 16 distinct values.
- Mean = 7.92566
- Std.dev = 2.15601
|
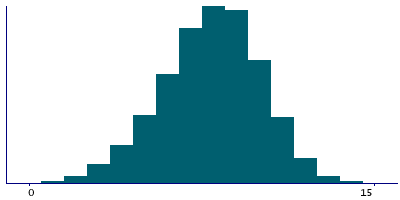
2 Instances
Instance 2 : Imaging visit (2014+)
81,621 participants, 81,621 items
| Maximum | 15 |
| Decile 9 | 11 |
| Decile 8 | 10 |
| Decile 7 | 9 |
| Decile 6 | 9 |
| Median | 8 |
| Decile 4 | 7 |
| Decile 3 | 7 |
| Decile 2 | 6 |
| Decile 1 | 5 |
| Minimum | 0 |
|
|
- There are 16 distinct values.
- Mean = 7.90872
- Std.dev = 2.16397
|
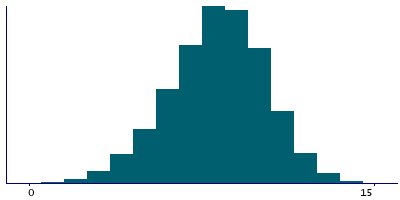
Instance 3 : First repeat imaging visit (2019+)
19,837 participants, 19,837 items
| Maximum | 15 |
| Decile 9 | 11 |
| Decile 8 | 10 |
| Decile 7 | 9 |
| Decile 6 | 9 |
| Median | 8 |
| Decile 4 | 8 |
| Decile 3 | 7 |
| Decile 2 | 6 |
| Decile 1 | 5 |
| Minimum | 0 |
|
|
- There are 16 distinct values.
- Mean = 7.99536
- Std.dev = 2.12152
|
Notes
This is the number of puzzles for which the participant gave the correct solution. It should be used in conjunction with
Field 6374 which describes the number of puzzles attempted. The range is 0-15.


