Data
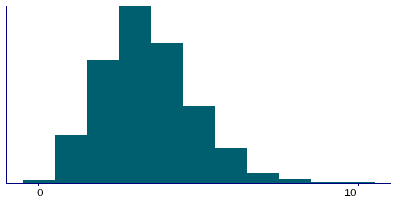
642,721 items of data are available, covering 500,773 participants.
Defined-instances run from 0 to 3, labelled using Instancing
2.
Units of measurement are hours.
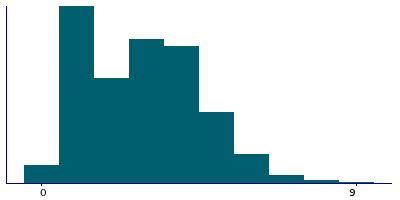
| Maximum | 72 |
| Decile 9 | 6 |
| Decile 8 | 5 |
| Decile 7 | 4 |
| Decile 6 | 4 |
| Median | 3 |
| Decile 4 | 3 |
| Decile 3 | 3 |
| Decile 2 | 2 |
| Decile 1 | 2 |
| Minimum | 0 |
|
|
- There are 38 distinct values.
- Mean = 3.6643
- Std.dev = 2.41521
- 18552 items above graph maximum of 10
|
4 Instances
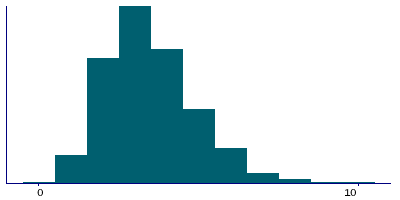
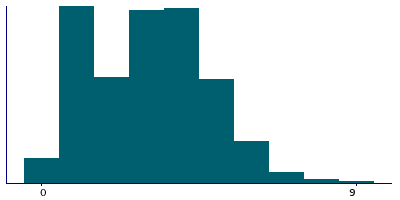
Instance 0 : Initial assessment visit (2006-2010) at which participants were recruited and consent given
500,707 participants, 500,707 items
| Maximum | 72 |
| Decile 9 | 6 |
| Decile 8 | 5 |
| Decile 7 | 4 |
| Decile 6 | 4 |
| Median | 3 |
| Decile 4 | 3 |
| Decile 3 | 3 |
| Decile 2 | 2 |
| Decile 1 | 2 |
| Minimum | 0 |
|
|
- There are 35 distinct values.
- Mean = 3.82721
- Std.dev = 2.46595
- 16430 items above graph maximum of 10
|
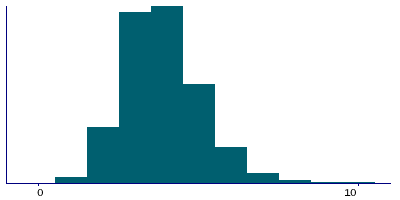
Instance 1 : First repeat assessment visit (2012-13)
20,314 participants, 20,314 items
| Maximum | 25 |
| Decile 9 | 6 |
| Decile 8 | 5 |
| Decile 7 | 4 |
| Decile 6 | 4 |
| Median | 4 |
| Decile 4 | 3 |
| Decile 3 | 3 |
| Decile 2 | 3 |
| Decile 1 | 2 |
| Minimum | 0 |
|
|
- There are 24 distinct values.
- Mean = 4.0098
- Std.dev = 1.74534
- 297 items above graph maximum of 10
|
Instance 2 : Imaging visit (2014+)
100,738 participants, 100,738 items
| Maximum | 58 |
| Decile 9 | 5 |
| Decile 8 | 4 |
| Decile 7 | 4 |
| Decile 6 | 3 |
| Median | 3 |
| Decile 4 | 2 |
| Decile 3 | 1 |
| Decile 2 | 1 |
| Decile 1 | 1 |
| Minimum | 0 |
|
|
- There are 32 distinct values.
- Mean = 2.91033
- Std.dev = 2.1584
- 1711 items above graph maximum of 9
|
Instance 3 : First repeat imaging visit (2019+)
20,962 participants, 20,962 items
| Maximum | 24 |
| Decile 9 | 5 |
| Decile 8 | 4 |
| Decile 7 | 4 |
| Decile 6 | 3 |
| Median | 3 |
| Decile 4 | 2 |
| Decile 3 | 2 |
| Decile 2 | 1 |
| Decile 1 | 1 |
| Minimum | 0 |
|
|
- There are 22 distinct values.
- Mean = 3.06144
- Std.dev = 2.10209
- 336 items above graph maximum of 9
|